

Volume 5, Issue 3 (july 2021)
AOH 2021, 5(3): 1022-1035 |
Back to browse issues page


![]()
![]()
![]()
Download citation:
BibTeX | RIS | EndNote | Medlars | ProCite | Reference Manager | RefWorks
Send citation to:


BibTeX | RIS | EndNote | Medlars | ProCite | Reference Manager | RefWorks
Send citation to:
Kocyigit-Cakir Z, Ozkan O. Incidence of Occupational Accidents and Contributing Factors among Male Workers in an Electrical Distribution Company in Istanbul, Turkey. AOH 2021; 5 (3) :1022-1035
URL: http://aoh.ssu.ac.ir/article-1-257-en.html
URL: http://aoh.ssu.ac.ir/article-1-257-en.html


1- MSc, Blood Donation Center, Istanbul Faculty of Medicine Hospital, Istanbul University, Istanbul, Turkey
2- Associate Professor, Kocaeli Academy for Solidarity, Kocaeli, Turkey• *Corresponding author: Ozlem Ozkan
2- Associate Professor, Kocaeli Academy for Solidarity, Kocaeli, Turkey• *Corresponding author: Ozlem Ozkan
Full-Text [PDF 4490 kb]
(218 Downloads)
| Abstract (HTML) (823 Views)
lectricity distribution is among the sectors of activity under electric power industry. The main components of this area of activity are line equipment, overhead line workers, engineers, general and transmission-distribution mechanics, field operators, and electric power users. 1,2 Electric power industry in general and its distribution in particular has evolved into an ever expanding sector employing huge number of workers all around the world. 2,3 For example, 393.110 workers were employed in electric power generation, transmission and distribution industry in 2018. 4 In Turkey, the total number of employees in 21 electric distribution companies increased from 26.574 in 2008 to 44.943 in 2016. 5
Both electric power industry and electric distribution inherently have mostly risky activities laden with various complicated and dangerous challenges. 2,6 There are many and various hazards and risks in electric distribution, including the existence, magnitude and strength of electric current, risk of explosion, wet, damp, noisy, windy, dusty, vibrant and high venues of work with risk of fire, insufficiency protective equipment, subcontracted work, the use of primitive techniques, etc. Moreover, breakdown, maintenance and repair workers in this sector are more prone to hazards and risks associated with electrical and mechanical issues as well as altitude and climate change. 2,7-14 For all these reasons, electric power generation and distribution in Turkey is regarded as “very dangerous”; while maintenance and repair of the counters in distribution and the rest of activities are classified as “dangerous” and “very dangerous”, respectively. 15
Such circumstances and conditions constitute the most serious threats for the workers’ life, health and well-being, paving the way for occupational accidents. 6,16,17 The prevalence of occupational accident among workers in electric power industry is 47% in Iceland, 5% in Denmark, 36% in Norway, 1% in Sweden, and 11% in Finland.18 Thirty percent of the workers among the total occupational accidents in electricity in the world and 78.5%
of those in Greece are in electric distribution industry. 3,19 The prevalence of occupational accident for workers in an electric distribution company is 33.3% in Iran. 7 In Turkey, the prevalence in electricity, gas, steam, water and sewage industry almost doubled in 2018 to reach 0.8% from 0.48% in 2009-2012. 20,21 The official figures by Turkish Statistical Institute (TSI) report 5.2% in 2007-2013.22 The prevalence of occupational accident in electric distribution in 2016 was 0.05% in Turkey 5, 10.3% in Konya province 23, and 6.5% in Ankara province14. Indeed, all these available figures about occupational accidents could be regarded as the tip of the iceberg. This is simply because of the recently increasing but yet limited number of research on the morbidity of the occupational accidents for workers in electric distribution all over the world, including Turkey. Moreover, the occupational accidents facing these workers have not been officially registered sufficiently and systematically at national and international
levels. 3, 16, 24-26
Even though the frequency of occupational accidents in electric power industry and electrical distribution sector are at lower levels, a considerable part of those accidents are dangerous and mostly result in severe or fatal injuries. 1-3,6,13,17,19,24,27 For instance, in the USA, 7% of the deaths caused by electric shocks were the maintenance workers in electricity sector. 1 In Turkey, half of the occupational accidents in electricity generation, transmission and distribution systems between 2011 and 2012 resulted in either fatal or severe injuries, which is ten times higher than the prevalence of overall occupational accidents. 20 Moreover, the occupational accidents in electric sector end up in disabilities, incapacity, and longer duration of work loss in many countries. 11,18,19,28
Occupational accidents are due to a combination of different work-related factors. Working conditions, including type of employment, shift work, job security, overtime work, workload,
6-8,14,16,19,24,26-30 work environment, insufficiency of personal protective and mechanical equipment, and inadequate safe work procedures were all found to cause occupational accidents. 3,7,19 Unfortunately, there are limited studies both in Turkey and in rest of the world on the occupational accident frequency for workers in electricity distribution, as well as on its causes, risk factors, and all associated factors. 1,6, 16,24 Moreover, there is no prospective study in Turkey on the incidence of occupational accidents and contributing factors. The aim of this study was to determine the incidence of occupational accidents and contributing factors related to individual and working life factors for male workers in breakdown, maintenance and repair units of an electricity distribution company in Istanbul, Turkey.
Methods
This prospective cohort study was conducted as part of a master’s thesis. 31
Setting
The study was conducted at Bogazici Electricity Distribution Corporation (BEDAS) which is the only electricity distribution company in European side of Istanbul, Turkey. This company was regarded as the largest electricity consumer in Turkey, serving almost 4.8 million users covering 12 districts in the European side of Istanbul by 2016. The company had a total of 5526 workers where 88% were subcontracted workers, 12% were permanent/ tenured staff, 2% were either mechanic or technician. All workers, except for those at pay desks, office, and Alo 186 call center, were all male.32
Population and sample
The study population was composed of male workers at department of breakdown, maintenance and repair services at BEDAS (N=1000). Within this department, there are overhead line, lighting, assembly, underground, and on-duty monitoring units. The workers were employed for 6 days of the week under three slots of work shifts per day.
Although the research sampling was initially planned to be conducted as probability sampling, the permissions were denied due to the lack of respective staff at the department receiving applications and the resign of the workplace doctor. Also, the continuous strike at BEDAS during the data collection was among the factors that negatively affected the participation of the workers to the research. In this regard, snowball sampling as one of the non-probability sampling techniques was used for research.
A total of 190 workers were reached, 32 of whom rejected to participate as either they regarded the research as unnecessary or they worried about the reactions from the employer or administrators. As a result, the research sample consisted of 158 voluntary male workers who agreed to participate.
Data collection
The data were collected using two semi-structured questionnaires with closed and open-ended questions developed on the basis of the literature surveyed.13,14,16,19,24,28,33 The first questionnaire consisted of questions about some socio-demographic characteristics of workers and questions on working life, including working conditions in the last year. Moreover, the incidence rate of self-reported occupational accident was determined in the past year by this form. The second questionnaire included questions about the characteristics of the accidents, the characteristics of the injury because of occupational accident and actual working conditions. The incidence rate of occupational accident based on four-month follow-up was obtained by this form.
The data were collected by face-to-face interviews with male workers between October 10, 2014 and February 25, 2015 within and out of working hours. After first questionnaire, each worker was provided a two-page information note on occupational accidents and individual consents were sought for a four-month follow-up. During follow-up, the workers were visited every week at their workplace and in their social surroundings. Moreover, reminder messages were sent to their mobiles, email addresses, and the Facebook page of their :union:, i.e. Enerji-Sen (:union: for Electricity, Gas, Water and Dam Workers) for notification in case of occupational accident. When the worker had an occupational accident, the second questionnaire form was used during the interview organized within the first 24 hours following the accident. Given the time range of the first interviews, the follow-up was completed by June 25, 2015.
Statistical analysis
The data were analyzed using Statistical Package for the Social Sciences (SPSS) (release 21.0) software. In chi-squared tests, p-values <0.05 were accepted as statistical significant. The degree and magnitude of association between dependent and independent variables were determined by Phi (Φ) and Cramer's V coefficient. When analyzing the data, the job title was categorized as “mechanic”, “technician” and “worker”, perceived health was aggregated as “good” and “bad,34 job security was categorized as “insecure” and “secure”,35 the severity of the injury was recoded as “mild” (work loss for less than one day), “moderate” (work loss for 1-4 days), and severe (work loss for 5 or more days). 12 The incidence rate of occupational accidents was presented as the number of workers who had an occupational accident per 100 person.
Results
Individual and working life characteristics of workers
The mean age of male workers was 33.04±8.448, with 41.1% below the age of 30. More than half (58.7%) had bad perceived health, and 45% had been diagnosed for any diseases. Around one out of six workers were in subcontracted employment and almost one out of three were not :union:ized. Moreover, one out of four workers had an occupational disease and more than half (62.7%) had witnessed an occupational accident at electricity sector at least once (Table 1). The majority of them (73.5%) earned less than 1700 New Turkish Lira (NTL) monthly when the official minimum wage in the country was 1201 NTL in 2015. Around one third (31%) had more than 9 hours unplanned overtime work per week; while one quarter of the workers had unplanned overtime work, more than half (58.2%) had a fast pace of work. Many of them lacked job security (70.9%) and had not received any training prior to work (85.4%). Given those characteristics and working conditions, the majority of workers (86.7%) stated that they were satisfied with their current job (Table 2).
The incidence rate of self-reported occupational accident and contributing factors in the past year
The incidence rate of self-reported occupational accident was 47.5% in the past year. The incidence rate was higher for those aged 41 and over (51.7%), for primary school graduates (52.0%), for those with more than 6 years of experience in this company (58.7%), for those employed as worker (55.2%) and hired by subcontractor (60%), as well as for those working in lighting and overhead line units (71.0%, 47.2%). This rate was also higher for those witnessed any occupational accident in the electricity sector (66.1%), with bad perceived health (58.7%) and with occupational disease (66.7%). It increased with age which was statistically significant (p=0.02). Working unit, occupational disease, and witnessing any occupational accident were statistically significant for the incidence of occupational accident, and there was moderate association between the three independent variables (p=0.040, p=0.01, p=0.000; Cramer’sV=0.255, Φ=0.209, Φ=0.288) (Table 1).
Table 1. Some individual and working life characteristics of workers who reported occupational accident in the past year
*Three of the workers who are widowed or divorced are included in the single category.
** The primary and secondary school graduates are aggregated. Moreover, five of the workers who are literate but lacking degree are also included in the primary and secondary level group because they had three years of formal primary education before they quit.
Table 2. The characteristics of working conditions of workers who reported occupational accident in the past year
Full-Text: (660 Views)
Incidence of Occupational Accidents and Contributing Factors among Male Workers in an Electrical Distribution Company in Istanbul, Turkey
Zehra Kocyigit-Cakir 1, Ozlem Ozkan 2*
1 MSc, Blood Donation Center, Istanbul Faculty of Medicine Hospital, Istanbul University, Istanbul, Turkey • 2 Associate Professor, Kocaeli Academy for Solidarity, Kocaeli, Turkey• *Corresponding author: Ozlem Ozkan, E-mail: ozooz50@yahoo.com
ABSTRACT
Background: This study aimed to determine the incidence of occupational accidents among male workers in an electric power distribution company and to analyze the contributing factors. Methods: This prospective cohort study was conducted on 158 male workers from an electricity distribution company in Istanbul (Turkey) between October 2014 and June 2015 in two phases. In the first phase, the data were collected with the face-to-face interviews based on a questionnaire related to the occupational accidents and working conditions in the past year. Then, each worker was followed-up for four months for the occupational accident incidence. The data were analyzed using SPSS software. The degree and magnitude of association between dependent and independent variables were determined by Phi (Φ) and Cramer's V coefficient. Results: The incidence rate of self-reported occupational accidents was 47.5% in the past year. The incidence was found to be higher for those aged over 41 (51.7%, p=0.02), work in lighting and overhead line units (71.0% and 47.2%, p=0.04), have occupational disease (66.7%, p=0.01), and have witnessed any occupational accident in the electricity sector (66.1%, p<0.001). The incidence rate was moderately associated with the working unit (Cramer’sV=0.25), witnessing any occupational accident (Φ=0.29), and occupational disease (Φ=0.21). It was higher for those with shift work (52.0%; p=0.29) and with job insecurity (51.8%, p=0.11). The incidence rate of occupational accidents based on four-month follow-up was 0.53 person-year. The most frequent type of accident was explosion (14.3%), and the majority of the accidents resulted in injuries (78.6%). Conclusion: The incidence of occupational accidents among male workers in the electricity distribution company was higher than the national average. The accidents were significantly related to the working conditions.
Keywords: Occupational accident; Electricity worker; Working conditions; Safety; Epidemiology
Introduction
| E |
Both electric power industry and electric distribution inherently have mostly risky activities laden with various complicated and dangerous challenges. 2,6 There are many and various hazards and risks in electric distribution, including the existence, magnitude and strength of electric current, risk of explosion, wet, damp, noisy, windy, dusty, vibrant and high venues of work with risk of fire, insufficiency protective equipment, subcontracted work, the use of primitive techniques, etc. Moreover, breakdown, maintenance and repair workers in this sector are more prone to hazards and risks associated with electrical and mechanical issues as well as altitude and climate change. 2,7-14 For all these reasons, electric power generation and distribution in Turkey is regarded as “very dangerous”; while maintenance and repair of the counters in distribution and the rest of activities are classified as “dangerous” and “very dangerous”, respectively. 15
Such circumstances and conditions constitute the most serious threats for the workers’ life, health and well-being, paving the way for occupational accidents. 6,16,17 The prevalence of occupational accident among workers in electric power industry is 47% in Iceland, 5% in Denmark, 36% in Norway, 1% in Sweden, and 11% in Finland.18 Thirty percent of the workers among the total occupational accidents in electricity in the world and 78.5%
of those in Greece are in electric distribution industry. 3,19 The prevalence of occupational accident for workers in an electric distribution company is 33.3% in Iran. 7 In Turkey, the prevalence in electricity, gas, steam, water and sewage industry almost doubled in 2018 to reach 0.8% from 0.48% in 2009-2012. 20,21 The official figures by Turkish Statistical Institute (TSI) report 5.2% in 2007-2013.22 The prevalence of occupational accident in electric distribution in 2016 was 0.05% in Turkey 5, 10.3% in Konya province 23, and 6.5% in Ankara province14. Indeed, all these available figures about occupational accidents could be regarded as the tip of the iceberg. This is simply because of the recently increasing but yet limited number of research on the morbidity of the occupational accidents for workers in electric distribution all over the world, including Turkey. Moreover, the occupational accidents facing these workers have not been officially registered sufficiently and systematically at national and international
levels. 3, 16, 24-26
Even though the frequency of occupational accidents in electric power industry and electrical distribution sector are at lower levels, a considerable part of those accidents are dangerous and mostly result in severe or fatal injuries. 1-3,6,13,17,19,24,27 For instance, in the USA, 7% of the deaths caused by electric shocks were the maintenance workers in electricity sector. 1 In Turkey, half of the occupational accidents in electricity generation, transmission and distribution systems between 2011 and 2012 resulted in either fatal or severe injuries, which is ten times higher than the prevalence of overall occupational accidents. 20 Moreover, the occupational accidents in electric sector end up in disabilities, incapacity, and longer duration of work loss in many countries. 11,18,19,28
Occupational accidents are due to a combination of different work-related factors. Working conditions, including type of employment, shift work, job security, overtime work, workload,
6-8,14,16,19,24,26-30 work environment, insufficiency of personal protective and mechanical equipment, and inadequate safe work procedures were all found to cause occupational accidents. 3,7,19 Unfortunately, there are limited studies both in Turkey and in rest of the world on the occupational accident frequency for workers in electricity distribution, as well as on its causes, risk factors, and all associated factors. 1,6, 16,24 Moreover, there is no prospective study in Turkey on the incidence of occupational accidents and contributing factors. The aim of this study was to determine the incidence of occupational accidents and contributing factors related to individual and working life factors for male workers in breakdown, maintenance and repair units of an electricity distribution company in Istanbul, Turkey.
Methods
This prospective cohort study was conducted as part of a master’s thesis. 31
Setting
The study was conducted at Bogazici Electricity Distribution Corporation (BEDAS) which is the only electricity distribution company in European side of Istanbul, Turkey. This company was regarded as the largest electricity consumer in Turkey, serving almost 4.8 million users covering 12 districts in the European side of Istanbul by 2016. The company had a total of 5526 workers where 88% were subcontracted workers, 12% were permanent/ tenured staff, 2% were either mechanic or technician. All workers, except for those at pay desks, office, and Alo 186 call center, were all male.32
Population and sample
The study population was composed of male workers at department of breakdown, maintenance and repair services at BEDAS (N=1000). Within this department, there are overhead line, lighting, assembly, underground, and on-duty monitoring units. The workers were employed for 6 days of the week under three slots of work shifts per day.
Although the research sampling was initially planned to be conducted as probability sampling, the permissions were denied due to the lack of respective staff at the department receiving applications and the resign of the workplace doctor. Also, the continuous strike at BEDAS during the data collection was among the factors that negatively affected the participation of the workers to the research. In this regard, snowball sampling as one of the non-probability sampling techniques was used for research.
A total of 190 workers were reached, 32 of whom rejected to participate as either they regarded the research as unnecessary or they worried about the reactions from the employer or administrators. As a result, the research sample consisted of 158 voluntary male workers who agreed to participate.
Data collection
The data were collected using two semi-structured questionnaires with closed and open-ended questions developed on the basis of the literature surveyed.13,14,16,19,24,28,33 The first questionnaire consisted of questions about some socio-demographic characteristics of workers and questions on working life, including working conditions in the last year. Moreover, the incidence rate of self-reported occupational accident was determined in the past year by this form. The second questionnaire included questions about the characteristics of the accidents, the characteristics of the injury because of occupational accident and actual working conditions. The incidence rate of occupational accident based on four-month follow-up was obtained by this form.
The data were collected by face-to-face interviews with male workers between October 10, 2014 and February 25, 2015 within and out of working hours. After first questionnaire, each worker was provided a two-page information note on occupational accidents and individual consents were sought for a four-month follow-up. During follow-up, the workers were visited every week at their workplace and in their social surroundings. Moreover, reminder messages were sent to their mobiles, email addresses, and the Facebook page of their :union:, i.e. Enerji-Sen (:union: for Electricity, Gas, Water and Dam Workers) for notification in case of occupational accident. When the worker had an occupational accident, the second questionnaire form was used during the interview organized within the first 24 hours following the accident. Given the time range of the first interviews, the follow-up was completed by June 25, 2015.
Statistical analysis
The data were analyzed using Statistical Package for the Social Sciences (SPSS) (release 21.0) software. In chi-squared tests, p-values <0.05 were accepted as statistical significant. The degree and magnitude of association between dependent and independent variables were determined by Phi (Φ) and Cramer's V coefficient. When analyzing the data, the job title was categorized as “mechanic”, “technician” and “worker”, perceived health was aggregated as “good” and “bad,34 job security was categorized as “insecure” and “secure”,35 the severity of the injury was recoded as “mild” (work loss for less than one day), “moderate” (work loss for 1-4 days), and severe (work loss for 5 or more days). 12 The incidence rate of occupational accidents was presented as the number of workers who had an occupational accident per 100 person.
Results
Individual and working life characteristics of workers
The mean age of male workers was 33.04±8.448, with 41.1% below the age of 30. More than half (58.7%) had bad perceived health, and 45% had been diagnosed for any diseases. Around one out of six workers were in subcontracted employment and almost one out of three were not :union:ized. Moreover, one out of four workers had an occupational disease and more than half (62.7%) had witnessed an occupational accident at electricity sector at least once (Table 1). The majority of them (73.5%) earned less than 1700 New Turkish Lira (NTL) monthly when the official minimum wage in the country was 1201 NTL in 2015. Around one third (31%) had more than 9 hours unplanned overtime work per week; while one quarter of the workers had unplanned overtime work, more than half (58.2%) had a fast pace of work. Many of them lacked job security (70.9%) and had not received any training prior to work (85.4%). Given those characteristics and working conditions, the majority of workers (86.7%) stated that they were satisfied with their current job (Table 2).
The incidence rate of self-reported occupational accident and contributing factors in the past year
The incidence rate of self-reported occupational accident was 47.5% in the past year. The incidence rate was higher for those aged 41 and over (51.7%), for primary school graduates (52.0%), for those with more than 6 years of experience in this company (58.7%), for those employed as worker (55.2%) and hired by subcontractor (60%), as well as for those working in lighting and overhead line units (71.0%, 47.2%). This rate was also higher for those witnessed any occupational accident in the electricity sector (66.1%), with bad perceived health (58.7%) and with occupational disease (66.7%). It increased with age which was statistically significant (p=0.02). Working unit, occupational disease, and witnessing any occupational accident were statistically significant for the incidence of occupational accident, and there was moderate association between the three independent variables (p=0.040, p=0.01, p=0.000; Cramer’sV=0.255, Φ=0.209, Φ=0.288) (Table 1).
Table 1. Some individual and working life characteristics of workers who reported occupational accident in the past year
| Individual Characteristics | Occupational accident | Test | p-value | ||
| Present | Absent | Total | |||
| n (%) | n (%) | n (%) | |||
| Age groups | χ2=9.593 | 0.02 | |||
| <30 | 28 (43.1) | 37 (56.9) | 65 (41.1) | ||
| 30-40 | 32 (50.0) | 32 (50.0) | 64 (40.5) | ||
| ≥41 | 15 (51.7) | 14 (48.3) | 29 (18.4) | ||
| Marital status | χ2=1.072 | 0.19 | |||
| Married | 45 (51.1) | 43 (48.9) | 88 (55.7) | ||
| Single* | 30 (42.9) | 40 (57.1) | 70 (44.3) | ||
| Education level** | χ2=2.151 | 0.34 | |||
| Primary/secondary school | 13 (52.0) | 12 (48.0) | 25 (15.8) | ||
| High school | 47 (50.5) | 46 (49.6) | 93 (58.9) | ||
| Associate’s degree | 15 (37.5) | 25 (62.5) | 40 (25.3) | ||
| Any disease diagnosed | χ2=0.056 | 0.81 | |||
| Yes | 66 (47.8) | 72 (52.2) | 138 (87.3) | ||
| No | 9 (45.0) | 11 (55.0) | 20 (12.7) | ||
| Perceived health | χ2=3.280 | 0.07 | |||
| Good | 48 (42.9) ) | 64 (57.1) | 112 (70.9) | ||
| Bad | 27 (58.7 | 19 (41.3) | 46 (29.1) | ||
| Working Life | χ2=6.529 | 0.16 | |||
| Total working experience (years) | |||||
| 1-5 | 13 (31.7) | 28 (68.3) | 41 (25.9) | ||
| 6-10 | 21 (55.3) | 17 (44.7) | 38 (24.1) | ||
| 11-15 | 16 (40.7) | 11 (59.3) | 27 (17.1) | ||
| 16-20 | 9 (47.4) | 10 (52.6) | 19 (12.0) | ||
| ≥21 | 16 (48.5) | 17 (51.5) | 33 (20.9) | ||
| Working experience in this company (years) | χ2=3.573 | 0.16 | |||
| <1 | 23 (40.4) | 34 (59.6) | 57 (36.1) | ||
| 1-5 | 25 (45.5) | 30 (54.5) | 55 (34.8) | ||
| ≥6 | 27 (58.7) | 19 (41.3) | 46 (29.1) | ||
| Job title | χ2=3.581 | 0.16 | |||
| Mechanic | 48 (50.0) | 48 (50.0) | 96 (60.8) | ||
| Technician | 11 (33.3) | 22 (66.7) | 33 (20.9) | ||
| Worker | 16 (55.2) | 13 (44.8) | 29 (18.3) | ||
| Working unit | χ2=10.048 Cramer’sV= 0.255 |
0.04 | |||
| Overhead line | 25 (47.2) | 28 (52.8) | 53 (33.5) | ||
| Lighting | 22 (71.0) | 9 (29.0) | 31 (19.6) | ||
| Assembly | 9 (33.3) | 18 (66.7) | 27 (17.1) | ||
| On-duty monitoring | 11 (42.3) | 15 (57.7) | 26 (16.5) | ||
| Underground | 8 (38.1) ) | 13 (61.9) | 21 (13.3) | ||
| Hiring firm | χ2=1.870 | 0.17 | |||
| Primary employer | 60 (45.1 | 73 (54.9) | 133 (84.2) | ||
| Subcontractor | 15 (60.0) | 10 (40.0) | 25 (15.8) | ||
| :union: membership | χ2=2.522 | 0.07 | |||
| No | 20 (38.5) | 32 (61.5) | 52 (32.9) | ||
| Yes | 55 (51.9) | 51 (48.1) | 106 (67.1) | ||
| Occupational disease | χ2=6.891 Φ=0.209 |
0.01 | |||
| No | 51 (41.8) | 71 (58.2) | 122 (77.2) | ||
| Yes | 24 (66.7) | 12 (33.3) | 36 (22.8) | ||
| Witness an occupational accident | χ2=13.111 Φ=0.288 |
0 00 | |||
| No | 36 (36.4) | 63 (63.6) | 99 (62.7) | ||
| Yes | 39 (66.1) | 20 (33.9) | 59 (37.3) | ||
| TOTAL | 75 (47.5) | 83 (52.5) | 158 (100.0) | ||
** The primary and secondary school graduates are aggregated. Moreover, five of the workers who are literate but lacking degree are also included in the primary and secondary level group because they had three years of formal primary education before they quit.
Table 2. The characteristics of working conditions of workers who reported occupational accident in the past year
| Working Conditions | Occupational accident | Test | p-value | ||
| Present | Absent | Total | |||
| n (%) | n (%) | n (%) | |||
| Monthly income (NTL) | χ2=1.203 | 0.54 | |||
| <1600 | 20 (46.5) | 23 (53.5) | 43 (27.2) | ||
| 1600-1700 | 45(50.6) | 44 (49.4) | 89 (56.3) | ||
| Unplanned weekly overtime work (hours) | χ2=1.249 | 0.29 | |||
| ≤2 | 13(52.0) | 12 (48.0) | 25 (15.8) | ||
| 3-4 | 14 (53.8) | 12 (46.2) | 26 (16.5) | ||
| 5-6 | 14 (48.3) | 15 (51.7) | 29 (18.4) | ||
| 7-8 | 13 (46.4) | 15 (53.6) | 28 (17.7) | ||
| ≥9 | 21 (42.0) | 29 (58.0) | 50 (31.6) | ||
| Pace of work | χ2=7.239 Φ=0.209 |
0.007 | |||
| Fast | 52(56.5) | 40 (43.5) | 92 (58.2) | ||
| Neither fast nor slow | 23 (31.3) | 43 (34.7) | 66 (41.8) | ||
| Any break during work | χ2=0.842 | 0.36 | |||
| Yes | 37(44.0) | 47 (56.0 | 84 (53.2) | ||
| No | 38(51.4) | 36 (48.6 | 74 (46.8) | ||
| Less workers for responding breakdowns | χ2=10.354 | 0.006 | |||
| Never | 10(25.6) | 29 (74.4) | 39 (24.7) | ||
| Occasionally | 55(53.4) | 48 (46.6) | 103 (65.2) | ||
| Frequently | 10(62.5) | 6 (37.5) | 16 (10.1) | ||
| Job security | χ2=2.876 | 0.11 | |||
| Insecure | 58(51.8) | 54 (48.2) | 112 (70.9) | ||
| Secure | 17(36.9) | 29 (40.1) | 46 (29.1) | ||
| Willingness to change work | |||||
| Yes | 33 (37.9) | 54 (62.1) | 87 (55.1) | χ2=7.062 Φ=0.207 |
0.006 |
| No | 42 (59.2) | 29 (40.8) | 71 (44.9) | ||
| Training prior to work | χ2=3.401 | 0.06 | |||
| Yes | 60 (44.4) | 75 (55.6) | 135 (85.4) | ||
| No | 15 (65.2) | 8 (34.8) | 23 (14.6) | ||
| Training during work | χ2=2.450 | 0.098 | |||
| Yes | 65 (45.5) | 78 (54.5) | 143 (90.5) | ||
| No | 10 (66.7) | 5 (33.3) | 15 (9.5) | ||
| Job satisfaction | 0.016 | ||||
| Yes | 60 (43.8) | 77 (56.2) | 137 (86.7) | χ2=5.576 Φ=0.185 |
|
| No | 15 (71.4) | 6 (28.6) | 21 (13.3) | ||
| TOTAL | 75 (47.5) | 83 (52.5) | 158 (100.0) | ||
The incidence rate of occupational accident was higher for those with unplanned weekly overtime work for 3-4 hours (53.8%, p=0.292), and those with job insecurity (51.8%, p=0.115). Besides, this rate was approximately two times higher for those working at fast pace (56.5%, p=0.007), those unwilling to change work (59.2%, p=0.006), and those unsatisfied with their current job (71.4%, p=0.016) than others. It occurred more frequently when less than three workers responded to breakdowns (p=0.006). There was a weak positive association between occupational accident and variables of pace of work (Φ=0.209), willingness to change work (Φ=0.207), and job satisfaction (Φ=0.185) (Table 2).
The incidence of occupational accident based on four-month follow-up period was 0.53 person-year (estimated 53% annually). The first occupational accident happened on the 9th day of the follow-up period (on October 19, 2014). Only three of the workers among 28 experiencing occupational accident were exposed to the accident twice. One third of the occupational accidents happened in November (32.1%), almost half on Mondays and Fridays (42.8%). The most frequent type of accident was explosion (14.3%) and violence by the user (14.3%). Majority of the accidents resulted in injuries (78.6%) and about half of the injuries (45.4) were severe. None of the workers were hospitalized or dead due to the accidents (Table 3).
The majority of the workers experiencing occupational accident were in 26-41 age group (67.9%), married (64.3%), and high school graduate (71.4%), were not exposed to occupational accident before (67.9%) and with 1-5 years of work experience in this company (50%). Most of them were employed at overhead line and lighting units (50% and 21.4%, respectively). The accidents happened mostly at substation building (21.4%) and during the morning work shift period (57.1%). The incidence rate of occupational accidents was higher for those with bad perceived health (67.9%), with fast pace of work (64.3%), those insecurely employed (75%), and those unsatisfied with current job (85.7%) (Table 4).
The three most frequent factors causing occupational accidents were insufficient personal protective equipment (37.8%), substation (12.2%), and lack of machinery-equipment-gear (8.1%) (Figure 1). Among all actions, the first three actions causing accidents were climbing on the electric pylon (15.4%), adverse weather conditions (12.8%) and cable stretching, cutting and laying (10.3%)
(Figure 2).
Table 3. Some characteristics of occupational accidents in the four-month follow-up (n=28)
*Other: Slide, traffic accident, intoxication, object in the eye, dog bite, prick of the object, fire, crush.
** Other: Fracture, prick, object in the eye, crush and soft tissue trauma, bruise and glaze, crush and amputation.
*** Other: Eyebrow-eye, head, eye, arm, hand and foot, arm and wrist, arm-leg-back, thumb, arm and face.
Table 4. Individual and working life characteristics of occupational accidents in the four-month follow-up (n=28)
*Other: Breakdown area, traffic, user, fuse switch (circuit breaker)
** Other: headworker, team leader
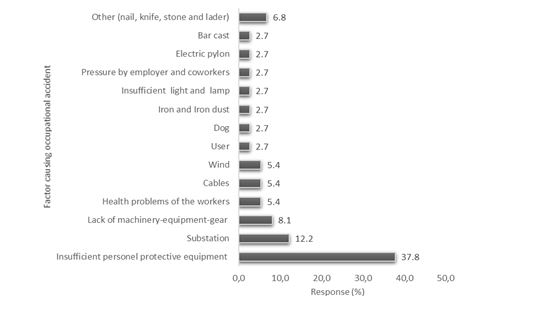
Figure 1. Factors causing occupational accidents (based on four-month follow-up)
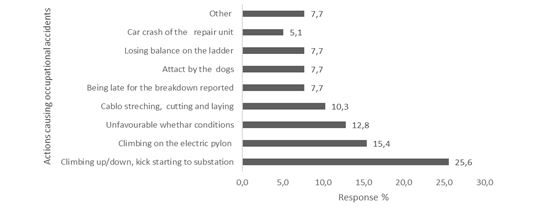
Figure 2. Actions causing occupational accidents (based on four-month follow-up)
| Characteristics of occupational accidents | n(%) | Characteristics of occupational accidents | n(%) |
| Month of the accident | Type of the accident | ||
| January | 2 (7.1) | Explosion | 4 (14.3) |
| February | 6 (21.4) | Verbal and physical violence by the user | 4(14.3) |
| March | 1 (3.6) | Burnt | 3 (10.7) |
| October | 5 (17.9) | Hit by or crash into an object | 3 (10.7) |
| November | 9 (32.1) | Cut by an abject | 33 (10.7) |
| December | 5 (17.9) | Falling | 2 (7.1) |
| Day of the accident | Other* | 9 (32.1) | |
| Monday | 6 (21.4) | Injury due to accident | |
| Tuesday | 1 (3.6) | Yes | 22 (78.6) |
| Wednesday | 3 (10.7) | No | 6 (21.4) |
| Thursday | 5 (17.9) | Type of the injury due to accident (n=22) | |
| Friday | 6 (21.4) | Burn | 6 (27.2) |
| Saturday | 4 (14.3) | Graze | 4 (18.2) |
| Sunday | 3 (10.7) | Fracture | 3 (13.6) |
| Time of the accident | Surface cut | 2 (9.1) | |
| 10:00-10:15 | 3 (10.7) | Other** | 7 (31.9) |
| 11:15-12:20 | 3 (10.7) | Injured body part due to accident (n=22) | |
| 13:05-13:50 | 5 (17.9) | Hand | 4 (18.2) |
| 14:00-16:35 | 8 (28.6) | Fingers | 4 (18.2) |
| 21:35-22:15 | 2 (7.1) | Foot | 2 (9.1) |
| 01:00-01:40 | 2 (7.1) | Toes | 2 (9.1) |
| Other hours | 5 (17.9) | Other*** | 10 (45.4) |
| Medical registry of the accident | Severity of the injury due to accident (n=22) | ||
| Yes | 13 (46.4) | Mild | 7 (31.9) |
| No | 15 (53.6) | Moderate | 5 (22.7) |
| Application to medical institution due to accident | Severe | 10 (45.4) | |
| Yes | 18 (64.3) | ||
| No | 10 (35.7) |
** Other: Fracture, prick, object in the eye, crush and soft tissue trauma, bruise and glaze, crush and amputation.
*** Other: Eyebrow-eye, head, eye, arm, hand and foot, arm and wrist, arm-leg-back, thumb, arm and face.
Table 4. Individual and working life characteristics of occupational accidents in the four-month follow-up (n=28)
| n(%) | n(%) | ||
| Age groups | Working experience in this company (years) | ||
| 18-25 | 4 (14.3) | 1-5 | 14 (50.0) |
| 26-33 | 11 (39.3) | 6-10 | 6 (21.4) |
| 34-41 | 8 (28.6) | ≥11 | 8(28.6) |
| ≥42 | 5 (17.9) | Work shifts (hours) | |
| Marital status | Morning (0700-1500) | 16 (57.1) | |
| Married | 18 (64.3) | Afternoon (1500-23.000) | 11 (39.3) |
| Single | 10 (35.7) | Night (2300-0700) | 11 (3.6) |
| Education level | Job title | ||
| Literate | 1 (3.6) | Mechanic | 19 (67.9) |
| Primary school | 2 (7.1) | Technician | 4 (14.3) |
| Junior high school | 1 (3.6) | Worker | 3(10.7) |
| High school | 20 (71.4) | Other** | 2 (7.1) |
| Associate’s degree | 4 (14.3) | Pace of work | |
| Prior occupational accident | Fast | 18 (64.3) | |
| Yes | 9 (32.1) | Neither fast nor slow | 10 (35.7) |
| No | 19 (67.9) | Unplanned weekly overtime work (hours) | |
| Working unit | ≤2 | 11 (39.3) | |
| Overhead line | 14 (50.0) | 3-4 | 2 (7.1) |
| Lighting | 6 (21.4) | 5-6 | 1 (3.6) |
| Assembly | 3 (10.7) | 7-8 | 3(10.7) |
| Underground | 3 (10.7) | ≥9 | 11(39.3) |
| On-duty monitoring | 2 (7.1) | Witness occupational accident | |
| Site of the accident | No | 27 (96.4) | |
| Substation building | 6 (21.4) | Yes | 1 (3.6) |
| Lighting | 5 (17.9) | Perceived health status | |
| Electric pylon | 5 (17.9) | Bad | 19 (67.9) |
| Substation pylon | 3 (10.7) | Good | 9 (32.1) |
| Underground cable | 3 (10.7) | Job satisfaction | |
| Other* | 6 (21.4) | Yes | 5 (14.3) |
| Job security | No | 24 (85.7) | |
| Insecure | 21 (75.0) | ||
| Secure | 7 (25.0) |
** Other: headworker, team leader
Figure 1. Factors causing occupational accidents (based on four-month follow-up)
Figure 2. Actions causing occupational accidents (based on four-month follow-up)
Discussion
This study suggested similar results with the other studies in Turkey and some other countries in identifying more than half of the workers in 18-33 age group and majority of them as high school graduates and with associate’s degree despite the limitations about non-probability sampling.14,16,24,32,33
The incidence rate of occupational accidents in four-month follow-up period was slightly higher than the incidence rate of self-reported occupational accidents in the past year. This points out to the impact of the prospective cohort study especially the importance of the follow-up and active surveillance system for occupational accidents. Moreover, the incidence rate of occupational accidents based on both self-reported and four-month follow-up in this study were higher than the incidence as reported in research on workers in electric distribution and electricity sector in some countries 6,7,18,24-26,33,36 and in Turkey. 5,14,20,21,23,37
The characteristics of occupational accidents, such as type, site, time, and severity of the status of the accident resulting in injury are of the great importance in term of both knowing and preventing. The occupational accidents in electricity sector in general and electric distribution in particular result in injuries whether fatal or not. 1,16 Similarly, the present study revealed that majority of the accidents in the four-month follow-up period resulted in injuries. This evidence was less than the frequency of injuries for workers in electric distribution in Turkey, 5,37 and more than the injuries for electric distribution workers in one district. 14 In every one of two injuries, the injured body parts were shoulder, arm, hand, and fingers, in line with the findings of other studies. 11,13,14,16,19,24,28 Compatible with the types of occupational accidents taking place, the most frequent injury type in this study was reported as burnt, graze, and fracture. Burnt and fracture point to the severity of injury; while graze occurs as a result of mild injury. In fact, burnt was due to electric arc caused by short circuit and explosion of the electrical devices because of short circuit; while fractures were mostly the results of working at heights. The findings about the type of injury were in accordance with studies on electric distribution workers in some countries 7,24,28 and in Turkey, 5,14,20 differing from some other studies. 6,12,29,36 Various studies on workers in electricity sector and electric distribution have shown that occupational accidents were both mostly fatal and required hospitalization. 3,5-7,12,14,16, 19,20,24,28,37 In the study, more than half of the injuries were severe and one out of eleven injuries were moderate, the sum of which corresponded to the ratio of application to a medical institution after the accident. Nevertheless, the injuries reported in this study did not required hospitalization and fortunately none of them were fatal. Indeed, some other studies reported opposite results contrary to the findings for severe and moderate degree of injuries, 12,14,20,37 which might be related to the differences in the degree/severity of the injury 12 classification techniques.
Individual characteristics of the workers (education level, age, health, marital status, working year, etc.) are among the factors affecting the occurrence and incidence of occupational accidents.14,16,20,23,24,29,37,39,40,41 The incidence rate of occupational accident based on self-reported and four-month follow-up were higher for married workers in this study in line with other studies16,24. Married workers are more likely to have fatigue, stress, and family problems, which might be related to the higher incidence and prevalence of occupational accident. 16,24 Likewise, this rate was higher when workers had bad perceived health, had any disease or occupational disease, were exposed to an occupational accident before, and witnessed occupational accident. This might be due to the linear relation between the poor/bad physical and mental health status of the worker and the accident and injury as shown in some other studies. 39,40 However, the incidence rate of both self-reported occupational accidents in the past year and occupational accident in the four-month follow-up period were different for age groups, education level, and work experience of workers. For example, similar to the findings of some other studies, 20,29,37 the incidence rate of occupational accident was higher for those over the age of 41 and lower for younger workers. Nevertheless, the incidence rate of occupational accident in the four-month follow-up period was higher for younger workers as shown by evidence from other studies. 3,5,6,14,16,19,23,24,39,41 Moreover, in line with the results of the studies, 7,16,20,24 the incidence rate of self-reported was higher among primary school graduates, and increased as the education level decreased. Consistent with the results of the studies, 5,14,23,37 the rate of occupational accident in the four-month follow-up period was higher for high school graduates and those with associate’s degree. The high rate for lower educational attainment levels might be related to the constraints imposed by low levels of education on acquiring the necessary technical knowledge and skills for electric breakdown, maintenance and repair units or lack of understanding or full awareness about hazards and risks.7 Even though half of the workers were high school graduate mechanics and one third were technicians with associate’s degree, the incidence rate of self-reported was higher for workers and mechanics. However, the incidence rate was higher for technicians in the four-month follow-up. This finding supports the association between the educational level and the incidence rate of occupational accident based on four-month follow-up. On the other hand, one research on electricity sector in the US and three research on electric distribution in Turkey found higher occupational accidents for mechanics. 14,20,23,29 In relation to the work experience of the workers, the available studies suggested huge variations in the incidence of occupational accident. 5,14,16,20,24,29,37 In this study, the incidence of occupational accidents in the follow-up period was higher and the incidence of self-reported occupational accidents in the past year was lower among those with 1-5 years of experience in this company where the frequency of the occupational accidents increased with work experience. The disparities between the incidence of self-reported occupational accidents in the past year and the incidence of occupational accidents in the follow-up period with respect to the individual characteristics of the workers might be due to differences in data collection techniques in two stages. However, this should be explored further with some other studies.
Another factor associated with the incidence of the occupational accidents is working life of the workers. 6-8,14,16,19,22,24,26-30 Shift work, work in fast pace, unplanned overtime work, lack of breaks during work, less number of workers responding to breakdowns in electric distribution, job insecurity, and insufficiency of regular professional and occupational health safety trainings prior to and during work are the symptoms of unhealthy and insecure working conditions, paving the way for occupational accidents and injuries. 39,40 Similar results were found in this study in line with other studies in electricity sector and electric distribution. 7,8,16,19,23,24,37Additionally, the findings of explosion, burst, hit by or crash into an object, and cut by an object as the most frequent types of occupational accidents indicate the risks associated with the working environment. While the occurrence of verbal and physical violence by the user indicates the unfavourable working
conditions. 7,14,16,19,24
In the present study, the incidence rate of occupational accident based on self-reported and four-month follow-up was higher for those working in lighting and overhead line units. Consistent with this result, the venue of the accident was mostly substations, lightings, and electricity pylon. Similarly, this field of work was found to be the 11th risky unit for electric distribution workers in Turkey. 14,20 Given most of the electricity transmission and distribution lines are overhead lines, working on overhead lines and lighting in the streets make workers prone to adverse weather conditions, insufficient personal protection equipment for working at power poles and towers or using earth digger or truck, working with electric power or using heavy tools and equipment. In line with the findings of the study, such conditions increase the risk as well as the occupational accidents and associated injuries. 1,3,6,12,17,26,29
The research on electric distribution workers in other countries revealed higher number of occupational accidents during summer season. 6,7,16,2438 However, the findings of the study revealed higher incidence in fall and winter due to the weather conditions, such as storm, snow, icing, cold weather, and rain, for workers in breakdown, maintenance and repair units who worked mostly in outdoor contexts. 2,5,20,37 The disparity in research evidence could be related to the limited duration of the follow-up period of the research in summer (i.e. 25 days). In relation to the high incidence of the occupational accidents on Mondays and Fridays, the challenge of adaptation to work after the weekend renders Monday risky as the first work day of the week; while the deterioration in the attention of the workers, fatigue or the probability of less care for taking precautions could explain the frequent occurrence on Fridays and Saturdays. 19,24,29,37 Despite such negative working conditions identified, majority of the workers expressed satisfaction with their current job and almost half were not willing to change their work in the present study. This contradictory finding should be treated with caution and needs to be further elaborated.
The key factor in preventing accidents is the knowledge on the real or primary causes. Scientific studies have demonstrated that the reasons or sources of the accidents were mostly explained on the basis of individual factors rather than work related factors or macroeconomic contexts. Unfortunately, this tendency holds also true for workers prone to accidents in electricity sector or electric distribution field of work. 18,33,39 Contrary to the common findings, only one worker out of ten workers defined the factor behind the occupational accident on the basis of individual factors (users, health problems or stress of the worker, the pressure by employer and colleagues) in the present study. More than half of the workers explained the causes of the occupational accidents by work-related factors and the rest referred to causes related to external environment, such as weather conditions. Those findings were in line with the findings of some other studies on electric distribution or electricity sector. 2,3,18,19,24 On the contrary, majority of the workers identified individual factors in two other studies in Turkey5,14 and working conditions in a research in Turkey20 as the main causes of occupational accidents.
This study had both strengths and limitations. The research was first of its kind in Turkey and one of the few studies in the international scope in determining the occupational accidents by prospective monitoring of the breakdown, maintenance and repair workers in electric distribution. However, there were also some limitations. One limitation was related to the sampling in which the population was not fully covered; since the choice of the sample could not be based on probability sampling due to the inability to get official approval from the electricity distribution company. Moreover, the number of workers covered in the sample was lower than the targeted value due to the dismissal of the workers during data collection process and continuous strike due to poor working conditions. The time constraint emerged as the third limitation in which the research was undertaken as part of a master’s thesis and the follow-up of the workers was reduced to four-months.
Conclusion
This study showed that the incidence rate of occupational accidents was higher for breakdown, maintenance and repair workers in electricity distribution compared to the existing data in Turkey. The occupational accidents were found to be associated with the working conditions of the workers. Moreover, given the nature of the prospective cohort study and the impact of the memory factor, the incidence of the self-reported occupational accidents were lower in the past year and higher in the four-month follow-up period. The following proposals were developed on the basis of the results of the study. It is required to conduct further studies on the morbidity of occupational accidents, the causes as well as the relations with the working conditions for the workers in electricity distribution and related
sub-domains, such as breakdown, maintenance and repair units. Additional, The occupational accidents should be systematically registered at the national level and the surveillance system should be developed. The researchers should be provided convenient conditions for scientific research on workers in electricity distribution by the private corporations.
Ethics approval
The research was conducted with the ethical approval from Kocaeli University Clinical Research Ethics Committee. The written and oral consents of workers were received prior to data collection with each of the question forms.
Conflict of interest
The authors declare that they have no competing interests.
Acknowledgement
The authors would like to thank all the workers who participated in this study.
Authors Contribution
Author OO and ZKC designed the study, ZKC searched literatures. ZKC responsible for data collection. OO and ZKC analyzed the data. OO wrote the first draft of the manuscript and ZKC revised the manuscript. All authors read and approved the final manuscript.
References
- Albert A, Hallowel MR. Safety risk management for electrical transmission and distribution line construction. Safety science. 2013;51(1):118-126.
- Rahman A, Uddin K, Islam S. Ensuring safety: A great challenge for electricity distribution system. Presented at 1st international conference on industrial engineering and operations management, Dhaka, Bangladesh. 2010. pp. 138-143. Available at: http://www.ieomsociety.org/paper/ 141Azizur.pdf.
- Batra PE. Ioannides MG. Electric accidents in the production, transmission, and distribution of electric energy: a review of the literature. International journal of occupational safety ergonomics. 2001;7(3):285-307.
- Bureau of Labor Statistics (BLS). Incidence rates of nonfatal occupational injuries and illnesses by industry and case types. 2018. Available at: https://www.bls.gov/iif/oshwc/ osh/os/summ1_00_2018.htm.
- Bilgir IO. Elektrik dagitim sektöründe is sagligi ve güvenligi mevzuatinin ve uygulamalarinin incelenmesi ve irdelenmesi. Master of science thesis, Cankaya University, Ankara. 2018. (in Turkish).
- Volberg V, Fordyce T, Leonhard M, Mezei G, Vergara X, Krishen L. Injuries among electric power industry workers, 1995–2013. Journal of safety research. 2016;60, 9-16.
- Kalte HO, Hosseini H, Arabzadeh S, Najafi H, Dehghan N, Akbarzadeh A, et al. Analysis of electrical accidents and the related causes involving citizens who are served by the Western of Tehran. Electron physician. 2014 6(2):820-827.
- Kalte HO, Ziaei M, Najafi H, Karami A, Akbarzadeh A, Ahmadnezhad I. Use of the Finnish method to quantify the ergonomic properties in an office environment among the workplaces in an Electricity Distribution Company in West Tehran Province. Electron physician. 2014 6(1):779-786.
- Amainen O, Moradi A, Eftekhari S. Assessment of psychosocial factors in office and operational groups of employees of a Regional Electricity Distribution Company in Iran-A case study. Heliyon. 2018;4(8):1-15.
- WorkSafeBC. Working safely around electricity. British Columbia: WorkSafeBC. 2012. Available at: http://www. worksafebc.com/publications/health_and_safety/by_topic/assets/pdf/electricity.pdf2012.
- Fordyce TA, Kelsh M, Lu ET, Sahl JD, Yager JW. Thermal burn and electrical injuries among electric utility workers, 1995–2004. Burns. 2007;33(2):209-220.
- Fordyce TA, Leonhard MJ, Watson HN, Mezei G, Vergara XP, Krishen L. An analysis of fatal and non-fatal injuries and injury severity factors among electric power industry workers. American journal of industrial medicine. 2016;59(11):948-958.
- Kelsh M, Sahl J. Sex differences in work-related injury rates among electric utility workers. American journal of epidemiology. 1996;143(10):1050-1058.
- Bilgen M. Ankara’da elektrik dagitim islerinde calisan iscilerde is kazalari ve meslek hastaliklari görülme sikligi ile iliskili etmenler. T.C. Calisma ve Sosyal Güvenlik Bakanligi Calisma ve Sosyal Güvenlik Egitim ve Arastırma Merkezi Yayinları: Ankara. Yayin no:37. 2013. Available at: http://www.casgem.gov.tr/dosyalar/kitap/37/dosya-37-888.pdf. (in Turkish).
- Republic of Turkey Ministry of Labour and Social Security (RTMLSS). Is sagligi ve güvenligine iliskin isyeri tehlike siniflari tebligi. RTLMLSS: Ankara. 2014. Available at: http://www.resmigazete.gov.tr/eskiler/2014/04/20140418-17.htm. (in Turkish).
- Sadeghain M, Farid RA, Dormohammadi A, Aghaei HA, Rahmani A, Farhadi R. et al. Assessment of the prevalence of occupational accidents and their influential factors in an electricity distribution company during a five-year period. Electron physician. 2013;5(2):643-650.
- Bracken TD, Sias GG, Kim C, Senior RS, Patterson RCM. Survey of electrical utility worker body impedance. IEEE transactions on power delivery. 2008;23(2):1251-1259.
- Kinnunen M. Electrical accidents hazards in the nordic countries. Master of science thesis. Tampere University of Technology: Finland. 2013. Available at:https://dspace.cc. tut.fi/dpub/recent-submissions? offset=20.
- Batra PE, Ioannides MG. Assessment of electric accidents in power industry. Human factors and ergonomics in manufacturing. 2002;12 (2):151–169.
- Avan M. Elektrik üretim, iletim ve dagitim sistemlerindeki is kazalarinin analizi. Master of science thesis. Kırıkkale University, Kırıkkale. 2014. (in Turkish).
- Social Security System (SSS). Is kazalari ve meslek hastaliklari istatistikleri. Chapter 3. SSS: Ankara. 2018. Available at: http://www.sgk.gov.tr/wps/portal/tr/ kurumsal/istatistikler (in Turkish)
- Turkish Statistical Institute (TSI). Is kazalari ve ise bagli saglik problemleri arastirma sonuclari 2013. TSI Haber Bülteni. 2014; No:16118. Available at: http://www.tuik. gov.tr/PreHaberBultenleri.do;jsessionid=lbyGWcwL0QByG5y31cGJKyhDqJpJT2TNJjcy0Jy1MYk8pLy2tY57!396785897?id=16118. (in Turkish)
- Sahin HI. Elektrik dagitim sektöründe calisanlarin is kazalari ve meslek hastaliklari nedenlerinin Konya merkezli örneginde incelenmesi. Master of science thesis. Bilecik Sey Edebali University, Bilecik. 2019. (in Turkish).
- Rahmani A, Khadem M, Aghaei HA, Madreseh E, Raei M, Karchani M. Descriptive study of occupational accidents and their causes among electricity distribution company workers at an eight-year period in Iran. Safety and health at work. 2013;4(3):160-165.
- Narine G. Causes and prevention of electric poweri Accidents: A Delphi study. Dissertation submitted in partial fulfillment of the requirements for the degree of doctor of philosophy. Walden University: Minneapolis, Minnesota. 2019. Available at: https://scholarworks.waldenu.edu/ dissertations/7495/.
- Yager JW, Kelsh MA, Zhao K, Mrad R. Development of an occupational illness and injury surveillance database for the electric energy sector. Applied occupational and environmental hygiene. 2001;16(2):291-294.
- Martinez MC, Fischer FM. Stress at work among electric utility workers. Industrial health journal. 2009;47(10):55-63.
- Piotrowski A, Fillet AM, Perez P, Walkowiak P, Simon DN, Corniere MJ. et al. Outcome of occupational electrical injuries among French electric company workers: a retrospective report of 311 cases, 1996-2005. Burns. 2014;40(3):480-488.
- Kelsh MA, Fordyce TA, Lau EC, Mink PJ, Morimoto LM, Lu ET. Factors that distinguish serious versus less severe strain and sprain injuries: an analysis of electric utility workers. American journal of industrial medicine. 2009;52(3):210–220.
- Melo MO, Silva LB, Rebelo FS. Ergonomics aspects and workload on the operators in the electric power control and operation centers; multi-case studies in Portugal and Brazil. Iberoamerican journal of industrial engineering. 2016;8(16):35-55.
- Kocyigit-Cakir Z. Bir elektrik dagitim sirketinde calisan işçilerde is kazasi insidansi, nedenleri ve yasadikları güclükler. Master of science thesis. Kocaeli University, Kocaeli. 2016. (in Turkish).
- Bogazici Electricity Distribution Corporation (BEDAS). Our history and about us. 2016. Available at: https://www. bedas.com.tr/en/.
- Tulonen T. Electrical accident risks in electrical work. PhD dissertion. Technology Tampere University: Tampere. 2010. Available at: http://www.tukes.fi/Tiedostot/
julkaisut/Electrical_Accident_Risks_in_Electrical_Work.pdf - Kunst AE, Mackenbach JP. Measuring socioeconomic inequalities in health. Copenhagen: WHO, 1984. pp.18-20.
- Ferrie JE, Shipley MJ, Newman K, Stansfeld SA, Marmot M. Self-reported job insecurity and health in the Whitehall II study: potential explanations of the relationship. Social science&medicine. 2005;60(7):1593-1602.
- Kelsh MA, Lu ET, Ramachandran K, Jesser C, Fordyce TA, Yager JW. Occupational injury surveillance among electric utility employees. Journal of occupational environmental medicine. 2004;46(9):974-984.
- Ceylan H. Turkiye’deki elektrik iletim tesislerinde meydana gelen is kazalarinin analizi. Electronic journal of vocational colleges. 2012;2(1):98-109. (in Turkish).
- Brearley M, Harrington P, Lee D, Taylor R. Working in hot conditions-A study of electrical utility workers in the Northern Territory of Australia. Journal of occupational and environmental hygiene. 2014;12(3):156–162.
- Khanzode VV, Maiti J, Ray PK. Occupational injury and accident research: a comprehensive review. Safety science. 2012;50(5):1355–1367.
- Muntaner C, Solar O, Vanroelen C, Martinez JM, Vergara M, Santana V. et al. Unemployment, informal work, precarious employment, child labor, slavery, and health inequalities: pathways and mechanisms. International journal of health services. 2010;40(2):281-95.
- Fordyce TA, Coalson J, Kelsh MA, Mezei G. Neck injuries among electric utility workers, 1995–2007. Journal of occupational and environmental medicine. 2010;52(4):441-449.
Type of Study: Research |
Subject:
General
Received: 2021/05/18 | Accepted: 2021/08/12 | Published: 2021/07/19
Received: 2021/05/18 | Accepted: 2021/08/12 | Published: 2021/07/19
| Rights and permissions | |
 |
This work is licensed under a Creative Commons Attribution-NonCommercial 4.0 International License. |