

Volume 6, Issue 1 (January 2022)
AOH 2022, 6(1): 1171-1182 |
Back to browse issues page

![]()
![]()
![]()
Download citation:
BibTeX | RIS | EndNote | Medlars | ProCite | Reference Manager | RefWorks
Send citation to:


BibTeX | RIS | EndNote | Medlars | ProCite | Reference Manager | RefWorks
Send citation to:
Philippe Henri D, Jean L. Validity of Estimating the 3 kHz Audiometric Threshold by Averaging the Thresholds at 2 and 4 kHz in Cases of Noise-Induced Hearing Loss. AOH 2022; 6 (1) :1171-1182
URL: http://aoh.ssu.ac.ir/article-1-265-en.html
URL: http://aoh.ssu.ac.ir/article-1-265-en.html


1- Federal Agency for Occupational Risks, B-1210 Brussels, Belgium , ph.dejonckere@outlook.com
2- Institute of Neurosciences, University of Louvain, B-1200 Brussels, Belgium
2- Institute of Neurosciences, University of Louvain, B-1200 Brussels, Belgium
Full-Text [PDF 4432 kb]
(308 Downloads)
| Abstract (HTML) (1265 Views)
ABSTRACT
Background: Hearing thresholds at 3000 Hz are generally not measured in routine clinical audiometry. However, for purposes other than clinical diagnosis, the threshold at 3 kHz has many applications, in epidemiological studies in the field of occupational health and medicine, as well as in (medicolegal) quantification of physical impairment due to hearing loss, particularly noise-induced hearing loss (NIHL). The present study addressed the validity of estimating, in the case of NIHL, the 3 kHz-audiometric thresholds by averaging the thresholds at 2 and 4 kHz. Methods: All 200 investigated subjects (400 ears) had a well-documented noise exposure, moderate to severe NIHL, and underwent, as they were claiming for compensation, a detailed medicolegal audiological investigation, including beside pure tone audiometry, electrophysiological objective frequency-specific threshold definition using cortical evoked response audiometry (CERA) and auditory steady-state response (ASSR). Results: The study results showed a good correlation between the 2-4 kHz interpolation and the actual 3 kHz threshold; the error may be around 2 dB on average. However, in individual cases, the results demonstrated that the error due to interpolation exceeds 5 dB HL in about one-quarter of the cases. This error is predictable; the larger the 2- 4 KHz difference (which reflects the steepness of the left slope of the audiometric notch), the larger the error (on either side) made by interpolating. Conclusion: For epidemiological studies with large amounts of data, the interpolated threshold (average of 2 and 4 KHz) may be considered as a valid estimate of the true value of the 3 KHz threshold. More caution is required in individual cases: the error due to interpolation exceeds 5 dB HL in about one-quarter of the cases, but this error is predictable.
Keywords: Hearing Loss; Noise-induced; Audiometry; Evoked Response; Auditory Threshold
Introduction
istorically, audiometric testing has been carried out at octave intervals based on powers of two: 250, 500, 1000, 2000, 4000, and 8000 Hz. It could be due to the fact that from the 19th century onwards, tuning forks with these frequencies were used. Thresholds at 3000 Hz are generally not measured in routine clinical audiometry. However, for purposes other than clinical diagnosis, the hearing threshold at 3 kHz has many applications, particularly in the field of (medicolegal) quantification of physical impairment due to hearing loss. For example, the Guides to the Evaluation of Permanent Impairment, now in its sixth edition (2021), presents the most comprehensive system of assessing impairment, utilizing many of the application designs established by the World Health Organization (WHO). 1 To calculate the hearing impairment, and subsequently the whole person's impairment, the algorithm requires the frequencies 0.5 kHz, 1 kHz, 2 kHz, and 3 kHz. 2 The American Academy of Otolaryngology-Head and Neck Surgery (AAO-HNS) standards for reporting hearing loss include pure tone audiometry (PTA) at 0.5, 1, 2, and 3 kHz. 3
More specifically, in the field of occupational medicine and noise-induced hearing loss (NIHL), hearing loss at 3 kHz also intervenes in defining permissible exposure limits (OSHA: US Occupational Safety and Health Administration, Neitzel & Fligor, 2017). 4 In this scope, the American Conference of Governmental Industrial Hygienists (ACGIH) has set its Threshold Limit Value (TLV) for noise as an 85 A-weighted decibel (dBA) 8 h-time-weighted average (ACGIH, 2018b). 5 The TLV was established to “protect the median of the population against an NIHL exceeding 2 dB after 40 years of occupational exposure for the average of 0.5, 1, 2, and 3 kHz”.
Fowler (1928) was probably the first to report about the audiometric 4 kHz-dip (or ‘notch’) caused by noise exposure. 6 Since then, the 4 kHz frequency has been of particular significance in occupational audiology and NIHL. However, a dip (or downward bulge) configuration of the audiogram can also occur after exposure to an explosion and in the case of a blast. 7,8 According to the OSHA, a Standard Threshold Shift (STS) is defined as a change in hearing threshold, relative to the baseline audiogram for a given employee, of an average of 10 dB or more at 2000, 3000, and 4000 Hz in one or both ears (https://www.osha.gov/laws-regs/regulations/standardnumber/1904/1904.10). 9 Dobie and Rabinowitz (2002) defined a Notch Index (NI) calculated by deducting the mean of the thresholds of 2, 3, and 4 kHz from the mean of the thresholds of 1 and 8 kHz. 10
Furthermore, compensation is a major issue in insurance medicine and needs to rely upon a valid quantification of social handicap or working incapacity. Lutman et al. (2016) proposed frequencies 1, 2, and 3 kHz to quantify NIHL based on average hearing threshold levels, 11 3 kHz being preferred to 4 kHz since it contains more speech information than 4 kHz. 12 Most insurance systems use the 3 kHz frequency for calculation worldwide. 13 The Belgian guideline uses algorithms, including the threshold at 3 kHz. 14 The German guideline (DGUV, 2020) considers the 4 kHz threshold if it is higher (more loss) than the 3 kHz, otherwise, it takes the 3 kHz threshold. 15
In addition to compensation issues, the 3 kHz-frequency has been used in research e.g., for investigating the correlation of subjective and objective thresholds (auditory brainstem responses, or the correspondence between Speech Reception Threshold (SRT) and PTA, or for quantifying Temporary Threshold Shift (TTS) in iron and steel factory workers. 16,17,18
All of this raises a relevant issue: how must audiograms - and particularly NIHL-audiograms - missing the 3 kHz threshold be analyzed? Two situations are common, including (1) retrospective research e.g., about exposure to noise and hearing loss, time progress of noise effect, comparisons about compensation systems, prevention programs, etc. (2) a need for a medicolegal decision in a socially insured person who provides a traditional (0,5-1-2-4-8 kHz) audiogram, but cannot undergo an expert examination (illness, moving abroad). The key question addressed in this study is “To what extent, or under which conditions can an average of the 2 and 4 kHz thresholds be considered as an acceptable substitute for the true 3 kHz threshold?”
In 1995, the Committee on Hearing and Equilibrium of the AAO-HNS considered - but without experimental data - that when thresholds at 3 kHz are not available, for example in retrospective studies, it may be acceptable to estimate the threshold at 3 kHz as the average thresholds at 2 and 4 kHz. 19 Gurgel et al. (2012) compared the averaged measured thresholds at 2 and 4 kHz with the measured threshold at 3 kHz in all-round patients (without specification) of an ENT clinic. They found a mean difference of 2 dB (SD: 6,50) between the measured and the interpolated 3 kHz thresholds, but the mean values were not mentioned. 20
More recently, Kim et al. (2018) addressed this issue by using a data collection originating from the Korea National Health and Nutrition Examination Survey, i.e., PTA from a representative sample of the normal South Korean population. Only subjects with normal tympanic membrane and no history of regular or occupational noise exposure were included. 21 Only air conduction thresholds were measured, using an automated testing procedure in a sound-treated booth. The authors found a strong correlation between the 3 kHz-thresholds and the 2-4 kHz averages, but with large (15 dB) upper and lower limits of agreement. In this study, the means of 3 kHz and 2-4 kHz thresholds were 16,2 dBHL and 16,6 dBHL, confirming normal/subnormal hearing levels.
Actually, the main practical need for the 3 kHz threshold is the medicolegal evaluation for compensation of NIHL. Therefore, in order to check the validity of the interpolation, certainly in that scope, the comparison between the measured and the calculated 3 kHz thresholds needs to be made on subjects with proven and well documented NIHL, and with a wide scale of degrees of severity. The ‘notched’ specificity of NIHL makes its audiological profile clearly different from the other two main causes of hearing loss, including conductive pathology and presbycusis.
However, when one deals with financial compensation, suspicious audiometric findings are not uncommon. 22 The prospect of financial advantages may cause either deliberately exaggerate hearing impairment or possibly unconsciously raise response criteria. 23 – 29 In this context, the validity of behavioral thresholds needs to be supported by frequency-specific objective techniques.
Hence, and contrary to the studies by Gurgel et al. (2012) and Kim et al. (2018). 3, 21 The present study was conducted on the subjects with documented noise exposure, moderate to severe NIHL, and those who, because of their compensation claim, underwent a detailed medicolegal audiological investigation, including electrophysiological objective threshold definition.
Methods
The present study is a non-interventional, retrospective analysis of the existing data obtained from previous audiological investigations.
Two sets of data were used in the present study, including a large set of 156 subjects (312 ears) and a limited set of 44 subjects (88 ears). Both sets originate from previous studies 14, 29 designed for comparing CERA and ASSR thresholds to each other and to behavioral thresholds.
As a rule, every claim for NIHL compensation at Fedris must be supported by an (external) audiological assessment. The claimant then receives an appointment for a medicolegal expert examination, including a new audiometry at Fedris. In the case of a significant discrepancy between the results of the two pure tone audiometries (the main inclusion criterion) the claimant was given a new appointment, usually a few weeks later, for another pure tone audiometry, followed by an electrophysiological assessment, consisting in both CERA and ASSR frequency-specific definition of hearing thresholds. The examination was completed, both for the first and second time, by a tympanometry, recording of acoustic stapedial reflexes, and if possible, a Békésy audiometry and a prosthetic audiometry.
All the subjects received adequate information about the different examination procedures. No subject refused the examinations. It should be noted that they claimed for compensation, and requested a forensic medical examination. In a medicolegal context, any invasive procedure is clearly ruled out. All the data were strictly anonymized, according to the standard rules and procedures applicable for scientific studies within Fedris. Prior to any investigation, each subject underwent a bilateral otoscopy to rule out the presence of ear wax or of any foreign object. Further exclusion criteria were middle ear pathology and conductive hearing loss (either uni- or bilateral), poor health, cognitive impairment or important difficulties in communicating due to language problems. Age, gender, and duration of exposure were systematically recorded. In an overwhelming majority, the subjects were males (147/156).
In the case of no measurable threshold, whichever the method, (i.e., no response at maximal level of stimulus), the threshold was considered to be 120 dBHL. For ASSR, only octave frequencies are available, i.e., 0.5, 1, 2, and 4 kHz (pure tone).
For CERA, a Bio-Logic Navigator PRO system (from Bio-logic Systems Corp) was used, with parameters, including stimulus 50 ms tone-burst, 1/s; filtering: 0,1 – 10 Hz; analysis epoch: 600 ms; # stimuli: 50 to 250; frequencies 1, 2 and 3 KHz. CERA responses were recorded four times at each intensity level. Based on the authors’ previous study, 23-26 the criterion for defining a CERA threshold was the lowest stimulus intensity (in dB HL, steps of 5 dB), evoking an unequivocal averaged response.
Considering the effect of sedative, hypnotic or neuroleptic drugs on CERA, cases reporting use of such drugs were not included in the present study, but without any possibility of controlling the subjects' report.
ASSRs were obtained using a Neuro-Audio.Net system from Neurosoft Ltd. The stimuli are pure tones (0.5, 1, 2, and 4 KHz), with a 100% amplitude and a 10% frequency modulation, the modulation frequency being around 46 Hz. After the stimulation has started, the algorithm seeks for a significant response in each of the frequency channels. As soon as the level of significance is reached, the algorithm stops recording in this particular channel (e.g., 55 dB at 2 kHz left), while recording continues in other channels. In the channel in which significance is reached, the stimulation automatically restarts with a 5 dB lower intensity, and the process is repeated until no significant response is obtained after 6 minutes. The time progress of the eight channels is permanently displayed, and the system also displays an ‘audiogram’. This process avoids any subjective interpretation.
For electrophysiological testing, the subject was lying on an examination couch, in a relaxed position, with his head resting on a pillow, and remained awake for the total duration of the testing.
Conventional as well as electrophysiological audiometric procedures were carried out in a soundproof booth (background noise measured inside 27 dBA), also operating as a Faraday cage. Acoustic stimuli were provided to the subject via two TDH-39 headphones.
(2) The limited data set (88 ears) 14
Forty-four subjects claiming for benefit at the Federal Agency for Occupational Diseases (Fedris, Brussels) and acceptable for inclusion in the analysis were considered in the present study, conducted over a 22-month period (2018 – 2020).
The essential criterion for inclusion in the ‘large data set’ study 29 was a suspicion of excessive reported NIHL, based on a worsening (≥ 5 dBHL on average at the best ear) of the threshold values obtained in PTA during the evaluation at Fedris, compared to those of the audiogram supplied by the claimant in his/her application document. The rationale of this approach has been explained in the authors’ previous article. 29 The main inclusion criterion in the ‘small data set’ study was the opposite of that of the ‘large data set’ study, i.e., the strict absence of any PTA threshold measured at Fedris that is higher (worse) than the corresponding threshold in the audiogram of the PTA supplied by the claimant with his/her application. When this condition was fulfilled, the subject was proposed to undergo a more in-depth electrophysiological investigation of his hearing status, consisting both ASSR and CERA hearing threshold assessments.
All further anamnestic, clinical, technical, and ethical requirements and conditions were similar to those of the large data set.
Arousal level was continuously monitored during the whole procedure of the examination.
Material and procedures were identical to those of the ‘large data set’ study.
The present study focused on statistical comparisons between intrapolated and measured thresholds, considering (1) the differences between the two variables (student’s paired t-test and the related effect size : Cohen’s d), (2) the strength of the relation between the two variables (the standard Pearson correlation coefficient r and the nonparametric Kendall’s coefficient of concordance W) to which is added the frequently used Cronbach’s Alpha, that measures the strength of internal consistency, (3) the reliability of the intrapolated thresholds and their agreement with the measured ones by means of the Intraclass Correlation Coefficient (ICC), that contains both information on the correlation and on a possible systematic difference between the paired values and (4) the Bland Altman plot, which graphically shows the mean of the differences between the two variables (fixed bias) and detects e.g. a possible proportional bias. The Bland-Altman plot also defines the upper (mean + 2 SD) and lower (mean - 2 SD) limits of the agreement interval and shows the outliers, but does not tell whether the agreement is sufficient or suitable to use a method or the other indifferently.
Statistical computations and graphs were made using the Statistica software (Statsoft Inc., Tusla, USA).
Results
Small set (88 ears)
Mean age was 64.07 (SD: 9.59) years, and mean duration of exposure to noise was 25.79 (SD: 10.52) years, similar to the characteristics of the ‘large set’.
In Fig. 1 the difference is shown between the measured (3 KHz) and the calculated (mean between 2 and 4 KHz) thresholds (mean, Standard Error (SE), Standard Deviation (SD), and outliers). The mean value for the average 2-4 KHz was 72.67 (SD 17.08) dBHL, and the mean value for 3 KHz was 74.49 (SD 17.44) dBHL. The difference (1.82 dB) was small but significant (p = 0.018 (n = 88) at student’s paired t-test). However, Cohen’s d, representing the difference between the groups in terms of their common standard deviation, is only 0.105, indicating that this difference may be considered negligible from a practical point of view. 30, 31
Table 1 gives, per side, the mean measured thresholds (and SD) for 2, 3, and 4 KHz.
Table 1. Mean measured thresholds in the limited data set (n = 88)
.JPG)
Figure 1. Difference between the measured threshold (3 KHz) and the calculated threshold (mean 2 and 4 KHz); Mean, Standard Error (SE), Standard Deviation (SD), and outliers.
.JPG)
Figure 2. Correlation plot (with regression line and CI) between the measured threshold (3 KHz) and the calculated threshold (mean 2 and 4 KHz). Pearson’s correlation coefficient is 0.92 (p < 0.001) (n = 88).
.JPG)
Figure 3. Progressive (quasi linear) increase of hearing loss (dBHL) (means, SD, SE and outliers) with increasing frequency. Regression line (least squares) corresponding to the sequence 1 – 2 – (2+4)/2 – 4 KHz (dBHL).
Table 1: Mean measured thresholds (and SD) for 2, 3, and 4 KHz (all values in dBnHL) in the limited data set (n = 88).
Fig. 2 shows the correlation plot (with regression line and confidence interval (CI)) between the measured (3 KHz) and the calculated (mean between 2 and 4 KHz) thresholds. Pearson’s correlation coefficient was 0.92 (p < 0.001) (n = 88).
The ICC, that assesses the reliability of measurement tools by comparing the variability of different measures on the same subject with the total variation across all measures and all subjects 32 was 0.92 (single) and 0.96 (meaned). An ICC > 0.8 indicates almost perfect agreement. 33
Cronbach’s alpha, reflecting the internal consistency between the true and estimated threshold was 0.96 [CI = 0.94 – 0.97] (n = 88). Values of 0.8 or higher indicate good reliability; 0.9 or higher values are considered excellent. 34 According to some studies, very high reliability (0.95 or higher) is not necessarily desirable, as this indicates that the items may be redundant. 35
Figs. 3 and 4 show the progressive (quasi linear) increase of hearing loss (dBHL) (means, SD, SE, and outliers) by increasing frequency. No obvious difference was observed between the regression lines (least squares) of the curves corresponding to the sequences 1 – 2 – (2+4)/2 – 4 KHz (dBHL) and 1 – 2 – 3 – 4 KHz.
Fig. 5 shows a Bland-Altman ‘difference - plot’ 36 - 37 of the differences between the two techniques (direct measure and intrapolation) vs. the averages of the two techniques ( n = 88). v1 represents the computed average (2 and 4 KHz) and v2 the measured 3 KHz value. Horizontal lines are drawn at the mean difference, and at the limits of agreement. The limits of agreement for a difference are defined as the mean difference ± 1.96 times the SD of the differences. The 95% CI of the mean difference was -15.83 to 12.19. This CI comprises 82 (out of 88) ears (93.2 %). The plot shows quite good agreement, without either a proportional error (difference increasing with mean value) or a variation that strongly depends on the magnitude of the measurements.
However, an histogram of the differences between the true (measured) 3 KHz threshold and the calculated one, as displayed in Fig. 6, reveals that the error exceeds 5 dB in 20 (out of 88) ears ( 23%). The error can be positive as well as negative.
This error (in absolute value) is proportional to the difference (also in absolute value) between 2 and 4 KHz, i.e., the two frequencies used for intrapolation (Fig. 7). Pearson’s r was 0.54 (p < 0.001); the larger the 2 – 4 KHz difference, the larger the error made by intrapolating. This 2 – 4 KHz difference actually reflects the steepness of the left slope of the audiometric notch.
There is also a weak negative correlation of this error due to intrapolation with the 2 KHz threshold (r = - 0.28 (p < 0.01)). A higher value of the 2 KHz threshold points in a context of NIHL on a broadening of the ‘notch’, suggests a smaller 2 – 4 KHz difference, and probably a larger 1 – 2 KHz difference. Indeed, the 2 – 4 KHz difference was negatively correlated with the 2 KHz threshold (r = - 0.42; p < 0.001).
Moreover, no correlation was found between the error due to intrapolation in absolute value and age (r = - 0.10), duration of noise exposure (r = - 0.11), global hearing loss (1-2-3 KHz) (r = - 0.19), average hearing loss 2 – 4 KHz (r = 0.07), threshold at 3 KHz (r = 0.11), and threshold at 4 KHz (r = 0.09).
It is a known fact that in NIHL, the dip may be located on 3 KHz (or also 6 KHz) instead of 4 KHz. 38 A broad notch may account for an equal threshold value on 3 and 4 KHz. In the ‘small’ dataset, the thresholds are equal in 3 and 4 KHz in 22 cases (25 %), while in 9 cases (10 %) the 3 KHz threshold was worse than the 4 KHz threshold. The mean difference (4 KHz – 3 KHz) was + 5.91 dBHL (SD 8.56) (min. -15 dBHL ; max. + 45 dBHL ).
.JPG)
Figure 4. Idem as As in Fig. 3, for the sequence 1 – 2 – 3 – 4 KHz (dBHL). There is no clear difference with the regression line of Fig. 3.
.JPG)
Figure 5. Bland-Altman plot of the differences between the two techniques (direct measure and intrapolation) versus the averages of the two techniques (n = 88). v1 represents the computed average (2 and 4 KHz) and v2 the measured 3 KHz value. Horizontal lines are drawn at the mean difference, and at the limits of agreement, which are defined as the mean difference ± 1.96 times the SD of the differences.
.JPG)
Figure 6. Histogram of the differences between the true (measured) 3 KHz threshold and the calculated value.
.JPG)
Figure 7. Correlation between the intrapolation ‘error’ (in absolute value) (difference between the measured and the calculated 3 KHz thresholds) and the difference (also in absolute value) between 2 and 4 KHz, i.e. the two frequencies used for intrapolation (n = 88). Pearson’s r is 0.54 (p < 0.001); the larger the 2 – 4 KHz difference, the larger the error made by intrapolating.
.JPG)
Figure 8. Correlation between CERA 3 KHz thresholds and calculated ASSR (2+4)/2 KHz thresholds. Pearson’s r = 0.631 (CI: 0.559 – 0.694) (p < 0.001) (n= 312).
.JPG)
Figure 9. Bland – Altman plot of the differences between the measured CERA threshold and the intrapolated ASSR 3 KHz value versus the averages of the two techniques. v1 represents the measured CERA threshold and v2 the intrapolated ASSR 3 KHz value. Horizontal lines are drawn at the mean difference, and at the limits of agreement, which are defined as the mean difference ± 1.96 times the SD of the differences. The plot shows a mean bias of 6.25 dB (n=312).
Table 2. Mean thresholds per technique in the large data set (n = 312)
Large set (312 ears)
Mean age was 63.37 (SD: 9.96) years. Mean duration of exposure to noise was 27.05 (SD: 11.38) years.
Table 2 gives the mean (and SD) electrophysiological thresholds at 1,2, and 3 KHz for CERA, and at 1, 2, and 4 KHz for ASSR. For ASSR the 3KHz threshold was calculated by intrapolation: (2+4)/2 KHz. All values were in DBnHL. The frequency 1 KHz was added to show the trend of increasing hearing loss from 1 to 3 or 4 KHz (in CERA as well as in ASSR).
Table 2: Mean thresholds with SD per technique and per frequency (all values in dBnHL) in the
large data set (n = 312). The difference between the ASSR and CERA thresholds was highlighted in the authors’ previous articles 14,29. This difference increased with frequency of 2,37 dB for 1 KHz and 5.0 dB for 2 KHz.
Between (2+4)/2 KHz (ASSR) and 3 KHz (CERA) the difference was 6.25 dB (student paired t-test: p < 0.001) (t = 6.47). Cohen’s d became 0.315, indicating a difference that is no longer negligible (as was the case for the small set of data), and corresponded to an ‘intermediate’ effect. 39
The correlation between CERA 3 KHz and ASSR (2+4)/2 KHz is shown in Fig. 8. Pearson’s r was 0.631 (CI: 0.559 – 0.694) (p < 0.001). The ICC that takes the bias into account was slightly lower (0.603), and the Bland – Altman plot (Fig. 9) makes this mean bias of 6.25 dB visible. v1 represents the measured CERA threshold and v2 the intrapolated ASSR 3 KHz value. Horizontal lines were drawn at the mean difference, and at the limits of agreement, defined as the mean difference ± 1.96 times the SD of the differences. In this case, the 95% CI of the mean difference was - 27.85 to 40.34 dB. The CI comprised 292 (out of 312) ears (93.6 %). The plot shows a reasonably good agreement, without either a proportional error (difference increases with mean value) or a variation that strongly depends on the magnitude of the measurements.
ICC is 0.603 (Model 3) (single) and 0.77 (meaned)
Kendall’ s W for agreement between ranks is 0.799 (p < 0.001)
Fig. 10 shows, for ASSR, the relationship between mean threshold and frequency, with the least squares regression line. As typical for NIHL, an increase was observed from 1 to 4 KHz.
In Fig. 11, the rise of the mean threshold with frequency (1-2-3 KHz) is compared in CERA and ASSR. For CERA, the 3 KHz threshold was the measured value, while for ASSR, the 3 KHz value was the calculated mean between the 2 and 4 KHz thresholds. A global shift was observed (ASSR thresholds were lower) but the shapes of the rise were very similar.
For ASSR, the step 1 KHz to 2 KHz corresponded to a threshold increase of 13.5%, while for CERA, the same step corresponded to a threshold increase of 17.0%. For CERA, the step 2 to 3 KHz corresponded to a threshold increase of 9.1%, while for ASSR, the step 2 to (2+4)/2 KHz corresponded to a threshold increase of 8.0%, as expected.
The measured CERA 3 KHz thresholds and intrapolated 3 KHz ASSR thresholds also show similar Gaussian distribution histograms, with a 6.25 dBHL shift (Fig. 12).
Discussion
As stated in the introduction, the actual need for the 2 – 4 KHz intrapolation is not its clinical relevance, but mainly its pertinence in medicolegal quantification of the degree of NIHL and its progress, particularly in a context of compensation, as many scales and baremas require this value.
.JPG)
Figure 10. Rise of the mean ASSR threshold with frequency (1 – 4 KHz), with the least squares regression line. As is typical for NIHL, there is an increase from 1 to 4 KHz.
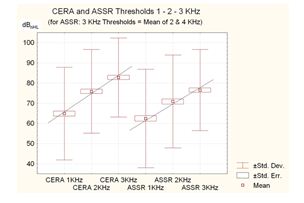
Figure 11. Increase of the mean threshold with frequency (1-2-3 KHz) compared to CERA and ASSR.

Figure 12. Comparative histograms of measured CERA 3 KHz thresholds and intrapolated 3 KHz ASSR thresholds. Both show a similar Gaussian distribution, with a 6.25 dBHL shift.
The 3 KHz threshold also becomes important in (retrospective) studies dealing with criteria, scales, barema’s, regulations (e.g., fitness for or removal from specific jobs/workplaces), comparisons of them, TTS, as well as correlations with a large variety of parameters, like age, degree of noise exposure, electrophysiological data, interaural asymmetry, etc. In the field of occupational health and safety, prevention and medicine, many epidemiological studies have also referred to 3 KHz thresholds.
Furthermore, medicolegal decision related to the precise degree of hearing loss in a socially insured person who provides traditional (0, 5-1-2-4-8 KHz) audiometrybut cannot undergo an expert examination (illness, moved abroad…) is required.
It is important to assess the adequacy of the 2 – 4 HKz intrapolation for both of these applications, and to exactly know the risk of error and its extent. Given the specific shape of the audiometric curve and its evolution in the case of NIHL, statistics dealing with normal subjects 21 as well as with all-round patients 3 are not really helpful. It is well known that NIHL is generally larger at 4 KHz and smaller at higher and lower frequencies, 40 a pattern that differs from presbycusis and most of other causes of hearing loss.
The present study addressed a critical need by dealing specifically with subjects presenting a wide scale of NIHL, with a well-documented and quantified noise exposure and seeking for compensation. Moreover, the data (in the small as well as in the large dataset) may be considered as fully reliable, since they were obtained by objective techniques. Indeed, it has been found that suspicious audiometric findings are not uncommon in a medicolegal context. 22 In the case of an insurance system with compensation for occupational diseases, such as noise induced hearing loss (NIHL), the prospect of financial advantages may encourage to either deliberately exaggerate hearing impairment or possibly unconsciously raise response criteria. 14, 23-29 Therefore, perfect reliability of the hearing thresholds is essential, indicating that the behavioral thresholds need to be systematically confirmed by objective and electrophysiological techniques. This also implied that the behavioral thresholds of the large data set were not suitable in the present study due to the uncertainty about their validity.
The study data showed a good correlation between the 2 – 4 KHz intrapolation and the actual 3 KHz thresholds, indicating that for epidemiological studies with large amounts of data, the intrapolated threshold may be considered as a valid estimate of the true value and the error may be around 2 dB on average. The results of the present study are in line with of the studies by Monsell (1995), Gurgel et al. (2012), and Kim et al. (2018). 3,19,21 Hence, NIHL is not distinctive. Moreover, the error does not seem to be influenced by age, duration of noise exposure, global degree of hearing loss, or specific threshold on 4 KHz (the most sensitive frequency for NIHL).
On the contrary, much more caution is required in individual cases. The data demonstrated that the error due to intrapolation exceedd 5 dB HL in about one quarter of cases. It is noteworthy that the test-retest variability inherent in properly calibrated audiometric equipment was +/- 5 dB. 41 With 5 dB measurement steps, the audiometric variability within the same test (intra-test variability) may be within +/- 5 dB. 12
Moreover, this error is to some extent predictable; the larger the 2 – 4 KHz difference (which reflects the steepness of the left slope of the audiometric notch), the larger the error (on either side) made by intrapolating.
Conclusion
The present study examined the validity of estimating, in the case of NIHL, the 3 KHz-audiometric threshold by averaging the thresholds at 2 and 4 KHz. It deals specifically with subjects presenting a wide scale of NIHL, with a well-documented and quantified noise exposure and seeking for compensation. Moreover, the data (in the small as well as in the large dataset) may be considered as fully reliable, since they were checked with an objective technique.
The data showed a good correlation between the 2 – 4 KHz intrapolation and the actual 3 KHz threshold, indicating that for epidemiological studies with large amounts of data, the intrapolated threshold may be considered as a valid estimate of the true value; the error may be around 2 dB on average.
Much more caution is required in an individual case. The data demonstrated that the error due to intrapolation exceedd 5 dB HL in about one quarter of the cases. This error is predictable; the larger the 2 – 4 KHz difference (which reflects the steepness of the left slope of the audiometric notch), the larger the error (on either side) made by intrapolating.
Conflict of interest
The authors declare that there is no conflict of interest.
Acknowledgment
The present study received no specific grant from any funding agency, commercial or non-profit sectors. It is a non-interventional, retrospective analysis of existing data obtained from previous audiological investigations. The authors thank the Federal Agency for Occupational Risks for making possible this study based on strictly anonymized data, according to the standard rules and procedures applicable for scientific studies within Fedris.
Authors Contribution
P.H. DeJonckere : Conceptualization ; methodology ; investigation ; writing (original draft) ; writing (review & editing)
J. Lebacq : Conceptualization ; methodology ; investigation ; writing (original draft) ; writing (review & editing).
References
1. AMA Guides to the Evaluation of Permanent Impairment, 6th ed. American Medical Association; 2021. Doi: 10.1001/978-1-64016-208-2
2.Colucci, D. AMA Hearing Loss/Tinnitus Guidelines. The Hearing Journal. 2016; 69(2): 40. Doi: 10.1097/01.HJ.0000480890.25214.bb
3. Gurgel RK, Popelka GR, Oghalai JS, Blevins NH, Chang KW, Jackler RK. Is it valid to calculate the 3-kilohertz threshold by averaging 2 and 4 kilohertz? Otolaryngol Head Neck Surg. 2012; 147(1): 102-104. Doi: 10.1177/0194599812437156.
6. Fowler EP. Limited lesions of the basilar membrane. Archives of Otolaryngology-head & Neck Surgery 1929; 10: 624- 632. Doi:10.1001/ARCHOTOL
7. Perez R, Gatt N, Cohen D. Audiometric configurations explosion following exposure to explosions. Arch Otolaryngol Head Neck Surg. 2000; 126: 1249 –1252.
8. Ziv M, Philipsohn NC, Leventon G, Man A. Blast injury of the ear: treatment and evaluation. Mil Med. 1973; 138: 811-813.
9. Berger EH & al., editors. The Noise Manual, revised 5th edition, edited by E.H. Berger, L.H. Royster, J.D. Royster, D.P. Driscoll, and M. Layne: American Industrial Hygiene Association; 2003.
10. Dobie RA, Rabinowitz PM. Change in audiometric configuration helps to determine whether a STS is work-related. Spectrum 2002; 19:17.
11. Lutman ME, Coles RRA, Buffin JT. Guidelines for quantification of noise-induced hearing loss in a medicolegal context. Clinical Otolaryngology 2016;41(4):347–57. Doi:10.1111/coa.12569
12. King PF, Coles RRA, Lutman ME, Robinson DW. Assessment of Hearing Disability: Guidelines for Medicolegal Practice. London John Wiley and Sons Ltd. 1992.
13. Mazlan AN, Yahya K. Compensation Process for Noise Induced Hearing Loss. Jurnal Teknologi. 2015;74 (4):13-7.
14. DeJonckere PH, Lebacq, J. The comparison of auditory behavioral and evoked potential responses (steady state and cortical) in subjects with occupational noise-induced hearing loss, Journal of Otology. 2021;16:242–51.
15. DGUV. Empfehlung für die Begutachtung der Lärmschwerhörigkeit (BK-Nr. 2301) – Königsteiner Empfehlung – Update 2020. Deutsche Gesetzliche Unfallversicherung e.V. (DGUV) Berlin; 2020.
16. Tenorio GA, Ferrite S, Teive e Argollo Dultra P. Summary Estimate of the differential between pure-tone and click ABR Thresholds in normal healing adults. International Archives of Otorhinolaryngology. 2007; 11: 54-59.
17. Kim JM, Na MS, Jung KH, Lee SH, Han JS, Lee OH, Park SY. The Best-Matched Pure Tone Average and Speech Recognition Threshold for Different Audiometric Configurations. Korean Journal of Otorhinolaryngology-Head and Neck Surgery. 2016 ; 59(10) : 725-729. doi: https://doi.org/10.3342/kjorl-hns.2016.59.10.725
18. Nyarubeli, IP, Bråtveit, M, Tungu, AM, Mamuya, SH and Moen, BE, 2021. Temporary Threshold Shifts among Iron and Steel Factory Workers in Tanzania: A Pre- Interventional Study. Annals of Global Health. 2021; 87(1): 35, 1 - 11. DOI: http://doi.org/10.5334/ aogh.3193
19. Monsell EM. New and revised reporting guidelines from the Committee on Hearing and Equilibrium. Otolaryngol Head Neck Surg. 1995; 113: 176 – 178.
20. Gurgel RK, Jackler RK, Dobie RA, Popelka GR. A new standardized format for reporting hearing outcome in clinical trials. Otolaryngol Head Neck Surg. 2012 ; 147(5) : 803-807.
21. Kim JY, Byun SW, Shin SH, Chun MS. Can an average of thresholds at 2 kHz and 4 kHz substitute for the threshold at 3 kHz in pure tone audiometry? A study based on the Korean National Health and Nutrition Examination Survey 2010–2012. PLoS ONE 13(8):e0201867. https://doi.org/10.1371/journal.pone.0201867. August 7, 2018. 10 pp.
22. Heo SD, Lee JM, Park JS, Choi A H, Kang MK. Evaluation of exaggerated hearing loss using objective audiometry. Korean Journal of Communication Disorders. 2008; 13 (3): 513 - 523.
23. DeJonckere, P.H., Van Dessel, F., De Granges de Surgères, G., Coryn C. Definition of frequency-specific hearing thresholds in subjects exaggerating their noise-induced hearing loss, in: Claussen, CF, Kirtane, MV, Schneider, D (Eds.) Proceedings NES Vol. 20; 1992: Dr Werner Rudat & Co, m+p edition Hamburg; 1992 p. 309 - 319.
24. DeJonckere, P H, Coryn, C, Lebacq, J. Cortical evoked response audiometry thresholds and neuroleptic, sedative, hypnotic drugs. Int. Tinnitus J. 2000; 6 : 25-28.
25. DeJonckere, P. H., Coryn, C., Lebacq, J. Experience with a medicolegal decision-making system for occupational hearing loss-related tinnitus. Int Tinnitus J. 2009; 15: 185-192.
26. DeJonckere, P.H., Coryn, C.. A comparison between middle latency responses and late auditory evoked potentials for approximating frequency-specific hearing levels in medicolegal patients with occupational hearing loss. Int. Tinnitus J. 2000; 6 : 175-81.
27. DeJonckere, P.H., Lebacq, J. Medicolegal decision making in noise-induced hearing loss-related tinnitus. Int. Tinnitus J. 2005 ; 11 : 92-96.
28. DeJonckere, P. H. Medicolegal decision making in noise-induced hearing loss-related tinnitus. In: Fayez Bahmad Jr, editor. Up to date on tinnitus. InTech, Rijeka, Croatia; 2011. p. 101 – 114.
29. DeJonckere P.H., Millet B., Van Gool R., Martens, A., Lebacq, J., 2021. Objective frequency-specific hearing thresholds definition for medicolegal purposes in case of occupational NIHL: ASSR outperforms CERA. Journal of Otology. 2021; 16: 210-219. https://doi.org/10.1016/j.joto.2021.02.002
30. Cohen, J. Statistical Power Analysis for the Behavioral Sciences. New York, NY: Routledge Academic: 1988.
31 McLeod, SA. What does effect size tell you? Simply psychology: https://www.simplypsychology.org/effect-size.html 2019, July 10, 2021.
32. Portney LG, Watkins MP. Foundations of Clinical Research. Applications and Practice. Norwalk: Appleton & Lange; 1993 : 509–516. ISBN 0-8385-1065-5.
33. Liljequist D, Elfving B, Roaldsen KS. Intraclass correlation – A discussion and demonstration of basic features. PlosOne 2019; 14 (7): e0219854. http://doi.org/10.1371/journal.pone.0219854.
34. Zeller R. Measurement error issues and solutions in : Encyclopedia of Social measurement Elsevier 2005 ; vol. 2 : 665 – 676. https://doi.org/10.1016/B0-12-369398-5/00109-2.
35. Panayides P Coefficient Alpha: Interpret With Caution. Europe's Journal of Psychology, 2013, Vol. 9(4), 687–696, doi:10.5964/ ejop.v9i4.653 . https://www.real-statistics.com/ reliability/internal-consistency-reliability/cronbachs-alpha/cronbachs-alpha-basic-concepts/ ).
36. Bland JM, Altman DG. Statistical method for assessing agreement between two methods of clinical measurement. The Lancet 1986; 327 : 307-310. https://doi.org/10.1016/S0140-6736(86)90837-8
37. Bland JM, Altman DG. Measuring agreement in method comparison studies. Statistical Methods in Medical Research. 1999; 8 (2) : 135 - 160. DOI: 10.1177/096228029900800204
38. Wilson RH, McArdle R. Characteristics of the audiometric 4,000 Hz notch (744.553 veterans) and the 3,000, 4,000, and 6,000 Hz notches (539,932 veterans). J Rehabil Res Dev. 2013 ; 50(1) : 111–132. http://dx.doi.org/10.1682/JRRD.2011.11.0225.
39. Feng L, Monvadi BS, Lim RP, Harrison A, King W, Adluru G, Dibella EVR, Sodickson DK, Otazo R, Kim D. Highly-Accelerated Real-Time Cardiac Cine MRI Using k-t SPARSE-SENSE. Magn Reson Med. 2013 ; 70(1): 64–74. doi:10.1002/mrm.24440.
40. ISO 1999 Acoustics: Estimation of Noise-Induced Hearing Loss. International Organization for Standardization, Geneva; 2013.
41. OSHA Occupational Injury and Illness Recording and Reporting Requirements - Final Rule. Washington DC; 2002. https://www.osha. gov/laws-regs/federalregister/2002-07-01-1.
Full-Text: (847 Views)
Validity of Estimating the 3 kHz Audiometric Threshold by Averaging the Thresholds at 2 and 4 kHz in Cases of Noise-Induced Hearing Loss
DeJonckere Philippe Henri 1*, Lebacq Jean 2
1 Federal Agency for Occupational Risks, B-1210 Brussels, Belgium• 2 Institute of Neurosciences, University of Louvain, B-1200 Brussels, Belgium• *Corresponding author: Prof. Philippe H, Email: ph.dejonckere@outlook.com
DeJonckere Philippe Henri 1*, Lebacq Jean 2
1 Federal Agency for Occupational Risks, B-1210 Brussels, Belgium• 2 Institute of Neurosciences, University of Louvain, B-1200 Brussels, Belgium• *Corresponding author: Prof. Philippe H, Email: ph.dejonckere@outlook.com
ABSTRACT
Background: Hearing thresholds at 3000 Hz are generally not measured in routine clinical audiometry. However, for purposes other than clinical diagnosis, the threshold at 3 kHz has many applications, in epidemiological studies in the field of occupational health and medicine, as well as in (medicolegal) quantification of physical impairment due to hearing loss, particularly noise-induced hearing loss (NIHL). The present study addressed the validity of estimating, in the case of NIHL, the 3 kHz-audiometric thresholds by averaging the thresholds at 2 and 4 kHz. Methods: All 200 investigated subjects (400 ears) had a well-documented noise exposure, moderate to severe NIHL, and underwent, as they were claiming for compensation, a detailed medicolegal audiological investigation, including beside pure tone audiometry, electrophysiological objective frequency-specific threshold definition using cortical evoked response audiometry (CERA) and auditory steady-state response (ASSR). Results: The study results showed a good correlation between the 2-4 kHz interpolation and the actual 3 kHz threshold; the error may be around 2 dB on average. However, in individual cases, the results demonstrated that the error due to interpolation exceeds 5 dB HL in about one-quarter of the cases. This error is predictable; the larger the 2- 4 KHz difference (which reflects the steepness of the left slope of the audiometric notch), the larger the error (on either side) made by interpolating. Conclusion: For epidemiological studies with large amounts of data, the interpolated threshold (average of 2 and 4 KHz) may be considered as a valid estimate of the true value of the 3 KHz threshold. More caution is required in individual cases: the error due to interpolation exceeds 5 dB HL in about one-quarter of the cases, but this error is predictable.
Keywords: Hearing Loss; Noise-induced; Audiometry; Evoked Response; Auditory Threshold
Introduction
| H |
More specifically, in the field of occupational medicine and noise-induced hearing loss (NIHL), hearing loss at 3 kHz also intervenes in defining permissible exposure limits (OSHA: US Occupational Safety and Health Administration, Neitzel & Fligor, 2017). 4 In this scope, the American Conference of Governmental Industrial Hygienists (ACGIH) has set its Threshold Limit Value (TLV) for noise as an 85 A-weighted decibel (dBA) 8 h-time-weighted average (ACGIH, 2018b). 5 The TLV was established to “protect the median of the population against an NIHL exceeding 2 dB after 40 years of occupational exposure for the average of 0.5, 1, 2, and 3 kHz”.
Fowler (1928) was probably the first to report about the audiometric 4 kHz-dip (or ‘notch’) caused by noise exposure. 6 Since then, the 4 kHz frequency has been of particular significance in occupational audiology and NIHL. However, a dip (or downward bulge) configuration of the audiogram can also occur after exposure to an explosion and in the case of a blast. 7,8 According to the OSHA, a Standard Threshold Shift (STS) is defined as a change in hearing threshold, relative to the baseline audiogram for a given employee, of an average of 10 dB or more at 2000, 3000, and 4000 Hz in one or both ears (https://www.osha.gov/laws-regs/regulations/standardnumber/1904/1904.10). 9 Dobie and Rabinowitz (2002) defined a Notch Index (NI) calculated by deducting the mean of the thresholds of 2, 3, and 4 kHz from the mean of the thresholds of 1 and 8 kHz. 10
Furthermore, compensation is a major issue in insurance medicine and needs to rely upon a valid quantification of social handicap or working incapacity. Lutman et al. (2016) proposed frequencies 1, 2, and 3 kHz to quantify NIHL based on average hearing threshold levels, 11 3 kHz being preferred to 4 kHz since it contains more speech information than 4 kHz. 12 Most insurance systems use the 3 kHz frequency for calculation worldwide. 13 The Belgian guideline uses algorithms, including the threshold at 3 kHz. 14 The German guideline (DGUV, 2020) considers the 4 kHz threshold if it is higher (more loss) than the 3 kHz, otherwise, it takes the 3 kHz threshold. 15
In addition to compensation issues, the 3 kHz-frequency has been used in research e.g., for investigating the correlation of subjective and objective thresholds (auditory brainstem responses, or the correspondence between Speech Reception Threshold (SRT) and PTA, or for quantifying Temporary Threshold Shift (TTS) in iron and steel factory workers. 16,17,18
All of this raises a relevant issue: how must audiograms - and particularly NIHL-audiograms - missing the 3 kHz threshold be analyzed? Two situations are common, including (1) retrospective research e.g., about exposure to noise and hearing loss, time progress of noise effect, comparisons about compensation systems, prevention programs, etc. (2) a need for a medicolegal decision in a socially insured person who provides a traditional (0,5-1-2-4-8 kHz) audiogram, but cannot undergo an expert examination (illness, moving abroad). The key question addressed in this study is “To what extent, or under which conditions can an average of the 2 and 4 kHz thresholds be considered as an acceptable substitute for the true 3 kHz threshold?”
In 1995, the Committee on Hearing and Equilibrium of the AAO-HNS considered - but without experimental data - that when thresholds at 3 kHz are not available, for example in retrospective studies, it may be acceptable to estimate the threshold at 3 kHz as the average thresholds at 2 and 4 kHz. 19 Gurgel et al. (2012) compared the averaged measured thresholds at 2 and 4 kHz with the measured threshold at 3 kHz in all-round patients (without specification) of an ENT clinic. They found a mean difference of 2 dB (SD: 6,50) between the measured and the interpolated 3 kHz thresholds, but the mean values were not mentioned. 20
More recently, Kim et al. (2018) addressed this issue by using a data collection originating from the Korea National Health and Nutrition Examination Survey, i.e., PTA from a representative sample of the normal South Korean population. Only subjects with normal tympanic membrane and no history of regular or occupational noise exposure were included. 21 Only air conduction thresholds were measured, using an automated testing procedure in a sound-treated booth. The authors found a strong correlation between the 3 kHz-thresholds and the 2-4 kHz averages, but with large (15 dB) upper and lower limits of agreement. In this study, the means of 3 kHz and 2-4 kHz thresholds were 16,2 dBHL and 16,6 dBHL, confirming normal/subnormal hearing levels.
Actually, the main practical need for the 3 kHz threshold is the medicolegal evaluation for compensation of NIHL. Therefore, in order to check the validity of the interpolation, certainly in that scope, the comparison between the measured and the calculated 3 kHz thresholds needs to be made on subjects with proven and well documented NIHL, and with a wide scale of degrees of severity. The ‘notched’ specificity of NIHL makes its audiological profile clearly different from the other two main causes of hearing loss, including conductive pathology and presbycusis.
However, when one deals with financial compensation, suspicious audiometric findings are not uncommon. 22 The prospect of financial advantages may cause either deliberately exaggerate hearing impairment or possibly unconsciously raise response criteria. 23 – 29 In this context, the validity of behavioral thresholds needs to be supported by frequency-specific objective techniques.
Hence, and contrary to the studies by Gurgel et al. (2012) and Kim et al. (2018). 3, 21 The present study was conducted on the subjects with documented noise exposure, moderate to severe NIHL, and those who, because of their compensation claim, underwent a detailed medicolegal audiological investigation, including electrophysiological objective threshold definition.
Methods
The present study is a non-interventional, retrospective analysis of the existing data obtained from previous audiological investigations.
Two sets of data were used in the present study, including a large set of 156 subjects (312 ears) and a limited set of 44 subjects (88 ears). Both sets originate from previous studies 14, 29 designed for comparing CERA and ASSR thresholds to each other and to behavioral thresholds.
- The ‘large’ data set (312 ears) 29
As a rule, every claim for NIHL compensation at Fedris must be supported by an (external) audiological assessment. The claimant then receives an appointment for a medicolegal expert examination, including a new audiometry at Fedris. In the case of a significant discrepancy between the results of the two pure tone audiometries (the main inclusion criterion) the claimant was given a new appointment, usually a few weeks later, for another pure tone audiometry, followed by an electrophysiological assessment, consisting in both CERA and ASSR frequency-specific definition of hearing thresholds. The examination was completed, both for the first and second time, by a tympanometry, recording of acoustic stapedial reflexes, and if possible, a Békésy audiometry and a prosthetic audiometry.
All the subjects received adequate information about the different examination procedures. No subject refused the examinations. It should be noted that they claimed for compensation, and requested a forensic medical examination. In a medicolegal context, any invasive procedure is clearly ruled out. All the data were strictly anonymized, according to the standard rules and procedures applicable for scientific studies within Fedris. Prior to any investigation, each subject underwent a bilateral otoscopy to rule out the presence of ear wax or of any foreign object. Further exclusion criteria were middle ear pathology and conductive hearing loss (either uni- or bilateral), poor health, cognitive impairment or important difficulties in communicating due to language problems. Age, gender, and duration of exposure were systematically recorded. In an overwhelming majority, the subjects were males (147/156).
In the case of no measurable threshold, whichever the method, (i.e., no response at maximal level of stimulus), the threshold was considered to be 120 dBHL. For ASSR, only octave frequencies are available, i.e., 0.5, 1, 2, and 4 kHz (pure tone).
For CERA, a Bio-Logic Navigator PRO system (from Bio-logic Systems Corp) was used, with parameters, including stimulus 50 ms tone-burst, 1/s; filtering: 0,1 – 10 Hz; analysis epoch: 600 ms; # stimuli: 50 to 250; frequencies 1, 2 and 3 KHz. CERA responses were recorded four times at each intensity level. Based on the authors’ previous study, 23-26 the criterion for defining a CERA threshold was the lowest stimulus intensity (in dB HL, steps of 5 dB), evoking an unequivocal averaged response.
Considering the effect of sedative, hypnotic or neuroleptic drugs on CERA, cases reporting use of such drugs were not included in the present study, but without any possibility of controlling the subjects' report.
ASSRs were obtained using a Neuro-Audio.Net system from Neurosoft Ltd. The stimuli are pure tones (0.5, 1, 2, and 4 KHz), with a 100% amplitude and a 10% frequency modulation, the modulation frequency being around 46 Hz. After the stimulation has started, the algorithm seeks for a significant response in each of the frequency channels. As soon as the level of significance is reached, the algorithm stops recording in this particular channel (e.g., 55 dB at 2 kHz left), while recording continues in other channels. In the channel in which significance is reached, the stimulation automatically restarts with a 5 dB lower intensity, and the process is repeated until no significant response is obtained after 6 minutes. The time progress of the eight channels is permanently displayed, and the system also displays an ‘audiogram’. This process avoids any subjective interpretation.
For electrophysiological testing, the subject was lying on an examination couch, in a relaxed position, with his head resting on a pillow, and remained awake for the total duration of the testing.
Conventional as well as electrophysiological audiometric procedures were carried out in a soundproof booth (background noise measured inside 27 dBA), also operating as a Faraday cage. Acoustic stimuli were provided to the subject via two TDH-39 headphones.
(2) The limited data set (88 ears) 14
Forty-four subjects claiming for benefit at the Federal Agency for Occupational Diseases (Fedris, Brussels) and acceptable for inclusion in the analysis were considered in the present study, conducted over a 22-month period (2018 – 2020).
The essential criterion for inclusion in the ‘large data set’ study 29 was a suspicion of excessive reported NIHL, based on a worsening (≥ 5 dBHL on average at the best ear) of the threshold values obtained in PTA during the evaluation at Fedris, compared to those of the audiogram supplied by the claimant in his/her application document. The rationale of this approach has been explained in the authors’ previous article. 29 The main inclusion criterion in the ‘small data set’ study was the opposite of that of the ‘large data set’ study, i.e., the strict absence of any PTA threshold measured at Fedris that is higher (worse) than the corresponding threshold in the audiogram of the PTA supplied by the claimant with his/her application. When this condition was fulfilled, the subject was proposed to undergo a more in-depth electrophysiological investigation of his hearing status, consisting both ASSR and CERA hearing threshold assessments.
All further anamnestic, clinical, technical, and ethical requirements and conditions were similar to those of the large data set.
Arousal level was continuously monitored during the whole procedure of the examination.
Material and procedures were identical to those of the ‘large data set’ study.
The present study focused on statistical comparisons between intrapolated and measured thresholds, considering (1) the differences between the two variables (student’s paired t-test and the related effect size : Cohen’s d), (2) the strength of the relation between the two variables (the standard Pearson correlation coefficient r and the nonparametric Kendall’s coefficient of concordance W) to which is added the frequently used Cronbach’s Alpha, that measures the strength of internal consistency, (3) the reliability of the intrapolated thresholds and their agreement with the measured ones by means of the Intraclass Correlation Coefficient (ICC), that contains both information on the correlation and on a possible systematic difference between the paired values and (4) the Bland Altman plot, which graphically shows the mean of the differences between the two variables (fixed bias) and detects e.g. a possible proportional bias. The Bland-Altman plot also defines the upper (mean + 2 SD) and lower (mean - 2 SD) limits of the agreement interval and shows the outliers, but does not tell whether the agreement is sufficient or suitable to use a method or the other indifferently.
Statistical computations and graphs were made using the Statistica software (Statsoft Inc., Tusla, USA).
Results
Small set (88 ears)
Mean age was 64.07 (SD: 9.59) years, and mean duration of exposure to noise was 25.79 (SD: 10.52) years, similar to the characteristics of the ‘large set’.
In Fig. 1 the difference is shown between the measured (3 KHz) and the calculated (mean between 2 and 4 KHz) thresholds (mean, Standard Error (SE), Standard Deviation (SD), and outliers). The mean value for the average 2-4 KHz was 72.67 (SD 17.08) dBHL, and the mean value for 3 KHz was 74.49 (SD 17.44) dBHL. The difference (1.82 dB) was small but significant (p = 0.018 (n = 88) at student’s paired t-test). However, Cohen’s d, representing the difference between the groups in terms of their common standard deviation, is only 0.105, indicating that this difference may be considered negligible from a practical point of view. 30, 31
Table 1 gives, per side, the mean measured thresholds (and SD) for 2, 3, and 4 KHz.
Table 1. Mean measured thresholds in the limited data set (n = 88)
| Frequency | Side | Mean Threshold | SD |
| 2 KHz | Right | 62.84 | 16.61 |
| 2 KHz | Left | 67.04 | 20.21 |
| 3 KHz | Right | 73.52 | 17.51 |
| 3 KHz | Left | 75.45 | 17.51 |
| 4 KHz | Right | 79.77 | 17.62 |
| 4 KHz | Left | 81.02 | 18.79 |
Figure 1. Difference between the measured threshold (3 KHz) and the calculated threshold (mean 2 and 4 KHz); Mean, Standard Error (SE), Standard Deviation (SD), and outliers.
Figure 2. Correlation plot (with regression line and CI) between the measured threshold (3 KHz) and the calculated threshold (mean 2 and 4 KHz). Pearson’s correlation coefficient is 0.92 (p < 0.001) (n = 88).
Figure 3. Progressive (quasi linear) increase of hearing loss (dBHL) (means, SD, SE and outliers) with increasing frequency. Regression line (least squares) corresponding to the sequence 1 – 2 – (2+4)/2 – 4 KHz (dBHL).
Table 1: Mean measured thresholds (and SD) for 2, 3, and 4 KHz (all values in dBnHL) in the limited data set (n = 88).
Fig. 2 shows the correlation plot (with regression line and confidence interval (CI)) between the measured (3 KHz) and the calculated (mean between 2 and 4 KHz) thresholds. Pearson’s correlation coefficient was 0.92 (p < 0.001) (n = 88).
The ICC, that assesses the reliability of measurement tools by comparing the variability of different measures on the same subject with the total variation across all measures and all subjects 32 was 0.92 (single) and 0.96 (meaned). An ICC > 0.8 indicates almost perfect agreement. 33
Cronbach’s alpha, reflecting the internal consistency between the true and estimated threshold was 0.96 [CI = 0.94 – 0.97] (n = 88). Values of 0.8 or higher indicate good reliability; 0.9 or higher values are considered excellent. 34 According to some studies, very high reliability (0.95 or higher) is not necessarily desirable, as this indicates that the items may be redundant. 35
Figs. 3 and 4 show the progressive (quasi linear) increase of hearing loss (dBHL) (means, SD, SE, and outliers) by increasing frequency. No obvious difference was observed between the regression lines (least squares) of the curves corresponding to the sequences 1 – 2 – (2+4)/2 – 4 KHz (dBHL) and 1 – 2 – 3 – 4 KHz.
Fig. 5 shows a Bland-Altman ‘difference - plot’ 36 - 37 of the differences between the two techniques (direct measure and intrapolation) vs. the averages of the two techniques ( n = 88). v1 represents the computed average (2 and 4 KHz) and v2 the measured 3 KHz value. Horizontal lines are drawn at the mean difference, and at the limits of agreement. The limits of agreement for a difference are defined as the mean difference ± 1.96 times the SD of the differences. The 95% CI of the mean difference was -15.83 to 12.19. This CI comprises 82 (out of 88) ears (93.2 %). The plot shows quite good agreement, without either a proportional error (difference increasing with mean value) or a variation that strongly depends on the magnitude of the measurements.
However, an histogram of the differences between the true (measured) 3 KHz threshold and the calculated one, as displayed in Fig. 6, reveals that the error exceeds 5 dB in 20 (out of 88) ears ( 23%). The error can be positive as well as negative.
This error (in absolute value) is proportional to the difference (also in absolute value) between 2 and 4 KHz, i.e., the two frequencies used for intrapolation (Fig. 7). Pearson’s r was 0.54 (p < 0.001); the larger the 2 – 4 KHz difference, the larger the error made by intrapolating. This 2 – 4 KHz difference actually reflects the steepness of the left slope of the audiometric notch.
There is also a weak negative correlation of this error due to intrapolation with the 2 KHz threshold (r = - 0.28 (p < 0.01)). A higher value of the 2 KHz threshold points in a context of NIHL on a broadening of the ‘notch’, suggests a smaller 2 – 4 KHz difference, and probably a larger 1 – 2 KHz difference. Indeed, the 2 – 4 KHz difference was negatively correlated with the 2 KHz threshold (r = - 0.42; p < 0.001).
Moreover, no correlation was found between the error due to intrapolation in absolute value and age (r = - 0.10), duration of noise exposure (r = - 0.11), global hearing loss (1-2-3 KHz) (r = - 0.19), average hearing loss 2 – 4 KHz (r = 0.07), threshold at 3 KHz (r = 0.11), and threshold at 4 KHz (r = 0.09).
It is a known fact that in NIHL, the dip may be located on 3 KHz (or also 6 KHz) instead of 4 KHz. 38 A broad notch may account for an equal threshold value on 3 and 4 KHz. In the ‘small’ dataset, the thresholds are equal in 3 and 4 KHz in 22 cases (25 %), while in 9 cases (10 %) the 3 KHz threshold was worse than the 4 KHz threshold. The mean difference (4 KHz – 3 KHz) was + 5.91 dBHL (SD 8.56) (min. -15 dBHL ; max. + 45 dBHL ).
Figure 4. Idem as As in Fig. 3, for the sequence 1 – 2 – 3 – 4 KHz (dBHL). There is no clear difference with the regression line of Fig. 3.
Figure 5. Bland-Altman plot of the differences between the two techniques (direct measure and intrapolation) versus the averages of the two techniques (n = 88). v1 represents the computed average (2 and 4 KHz) and v2 the measured 3 KHz value. Horizontal lines are drawn at the mean difference, and at the limits of agreement, which are defined as the mean difference ± 1.96 times the SD of the differences.
Figure 6. Histogram of the differences between the true (measured) 3 KHz threshold and the calculated value.
Figure 7. Correlation between the intrapolation ‘error’ (in absolute value) (difference between the measured and the calculated 3 KHz thresholds) and the difference (also in absolute value) between 2 and 4 KHz, i.e. the two frequencies used for intrapolation (n = 88). Pearson’s r is 0.54 (p < 0.001); the larger the 2 – 4 KHz difference, the larger the error made by intrapolating.
Figure 8. Correlation between CERA 3 KHz thresholds and calculated ASSR (2+4)/2 KHz thresholds. Pearson’s r = 0.631 (CI: 0.559 – 0.694) (p < 0.001) (n= 312).
Figure 9. Bland – Altman plot of the differences between the measured CERA threshold and the intrapolated ASSR 3 KHz value versus the averages of the two techniques. v1 represents the measured CERA threshold and v2 the intrapolated ASSR 3 KHz value. Horizontal lines are drawn at the mean difference, and at the limits of agreement, which are defined as the mean difference ± 1.96 times the SD of the differences. The plot shows a mean bias of 6.25 dB (n=312).
Table 2. Mean thresholds per technique in the large data set (n = 312)
| 1 KHz | 2 KHz | 3 KHz | (2+4) / 2 KHz | 4 KHz | |
|
|
|
|
|
||
|
|
|
|
|
|
|
| ∆ CERA-ASSR |
|
|
|
Mean age was 63.37 (SD: 9.96) years. Mean duration of exposure to noise was 27.05 (SD: 11.38) years.
Table 2 gives the mean (and SD) electrophysiological thresholds at 1,2, and 3 KHz for CERA, and at 1, 2, and 4 KHz for ASSR. For ASSR the 3KHz threshold was calculated by intrapolation: (2+4)/2 KHz. All values were in DBnHL. The frequency 1 KHz was added to show the trend of increasing hearing loss from 1 to 3 or 4 KHz (in CERA as well as in ASSR).
Table 2: Mean thresholds with SD per technique and per frequency (all values in dBnHL) in the
large data set (n = 312). The difference between the ASSR and CERA thresholds was highlighted in the authors’ previous articles 14,29. This difference increased with frequency of 2,37 dB for 1 KHz and 5.0 dB for 2 KHz.
Between (2+4)/2 KHz (ASSR) and 3 KHz (CERA) the difference was 6.25 dB (student paired t-test: p < 0.001) (t = 6.47). Cohen’s d became 0.315, indicating a difference that is no longer negligible (as was the case for the small set of data), and corresponded to an ‘intermediate’ effect. 39
The correlation between CERA 3 KHz and ASSR (2+4)/2 KHz is shown in Fig. 8. Pearson’s r was 0.631 (CI: 0.559 – 0.694) (p < 0.001). The ICC that takes the bias into account was slightly lower (0.603), and the Bland – Altman plot (Fig. 9) makes this mean bias of 6.25 dB visible. v1 represents the measured CERA threshold and v2 the intrapolated ASSR 3 KHz value. Horizontal lines were drawn at the mean difference, and at the limits of agreement, defined as the mean difference ± 1.96 times the SD of the differences. In this case, the 95% CI of the mean difference was - 27.85 to 40.34 dB. The CI comprised 292 (out of 312) ears (93.6 %). The plot shows a reasonably good agreement, without either a proportional error (difference increases with mean value) or a variation that strongly depends on the magnitude of the measurements.
ICC is 0.603 (Model 3) (single) and 0.77 (meaned)
Kendall’ s W for agreement between ranks is 0.799 (p < 0.001)
Fig. 10 shows, for ASSR, the relationship between mean threshold and frequency, with the least squares regression line. As typical for NIHL, an increase was observed from 1 to 4 KHz.
In Fig. 11, the rise of the mean threshold with frequency (1-2-3 KHz) is compared in CERA and ASSR. For CERA, the 3 KHz threshold was the measured value, while for ASSR, the 3 KHz value was the calculated mean between the 2 and 4 KHz thresholds. A global shift was observed (ASSR thresholds were lower) but the shapes of the rise were very similar.
For ASSR, the step 1 KHz to 2 KHz corresponded to a threshold increase of 13.5%, while for CERA, the same step corresponded to a threshold increase of 17.0%. For CERA, the step 2 to 3 KHz corresponded to a threshold increase of 9.1%, while for ASSR, the step 2 to (2+4)/2 KHz corresponded to a threshold increase of 8.0%, as expected.
The measured CERA 3 KHz thresholds and intrapolated 3 KHz ASSR thresholds also show similar Gaussian distribution histograms, with a 6.25 dBHL shift (Fig. 12).
Discussion
As stated in the introduction, the actual need for the 2 – 4 KHz intrapolation is not its clinical relevance, but mainly its pertinence in medicolegal quantification of the degree of NIHL and its progress, particularly in a context of compensation, as many scales and baremas require this value.
Figure 10. Rise of the mean ASSR threshold with frequency (1 – 4 KHz), with the least squares regression line. As is typical for NIHL, there is an increase from 1 to 4 KHz.
Figure 11. Increase of the mean threshold with frequency (1-2-3 KHz) compared to CERA and ASSR.
Figure 12. Comparative histograms of measured CERA 3 KHz thresholds and intrapolated 3 KHz ASSR thresholds. Both show a similar Gaussian distribution, with a 6.25 dBHL shift.
The 3 KHz threshold also becomes important in (retrospective) studies dealing with criteria, scales, barema’s, regulations (e.g., fitness for or removal from specific jobs/workplaces), comparisons of them, TTS, as well as correlations with a large variety of parameters, like age, degree of noise exposure, electrophysiological data, interaural asymmetry, etc. In the field of occupational health and safety, prevention and medicine, many epidemiological studies have also referred to 3 KHz thresholds.
Furthermore, medicolegal decision related to the precise degree of hearing loss in a socially insured person who provides traditional (0, 5-1-2-4-8 KHz) audiometrybut cannot undergo an expert examination (illness, moved abroad…) is required.
It is important to assess the adequacy of the 2 – 4 HKz intrapolation for both of these applications, and to exactly know the risk of error and its extent. Given the specific shape of the audiometric curve and its evolution in the case of NIHL, statistics dealing with normal subjects 21 as well as with all-round patients 3 are not really helpful. It is well known that NIHL is generally larger at 4 KHz and smaller at higher and lower frequencies, 40 a pattern that differs from presbycusis and most of other causes of hearing loss.
The present study addressed a critical need by dealing specifically with subjects presenting a wide scale of NIHL, with a well-documented and quantified noise exposure and seeking for compensation. Moreover, the data (in the small as well as in the large dataset) may be considered as fully reliable, since they were obtained by objective techniques. Indeed, it has been found that suspicious audiometric findings are not uncommon in a medicolegal context. 22 In the case of an insurance system with compensation for occupational diseases, such as noise induced hearing loss (NIHL), the prospect of financial advantages may encourage to either deliberately exaggerate hearing impairment or possibly unconsciously raise response criteria. 14, 23-29 Therefore, perfect reliability of the hearing thresholds is essential, indicating that the behavioral thresholds need to be systematically confirmed by objective and electrophysiological techniques. This also implied that the behavioral thresholds of the large data set were not suitable in the present study due to the uncertainty about their validity.
The study data showed a good correlation between the 2 – 4 KHz intrapolation and the actual 3 KHz thresholds, indicating that for epidemiological studies with large amounts of data, the intrapolated threshold may be considered as a valid estimate of the true value and the error may be around 2 dB on average. The results of the present study are in line with of the studies by Monsell (1995), Gurgel et al. (2012), and Kim et al. (2018). 3,19,21 Hence, NIHL is not distinctive. Moreover, the error does not seem to be influenced by age, duration of noise exposure, global degree of hearing loss, or specific threshold on 4 KHz (the most sensitive frequency for NIHL).
On the contrary, much more caution is required in individual cases. The data demonstrated that the error due to intrapolation exceedd 5 dB HL in about one quarter of cases. It is noteworthy that the test-retest variability inherent in properly calibrated audiometric equipment was +/- 5 dB. 41 With 5 dB measurement steps, the audiometric variability within the same test (intra-test variability) may be within +/- 5 dB. 12
Moreover, this error is to some extent predictable; the larger the 2 – 4 KHz difference (which reflects the steepness of the left slope of the audiometric notch), the larger the error (on either side) made by intrapolating.
Conclusion
The present study examined the validity of estimating, in the case of NIHL, the 3 KHz-audiometric threshold by averaging the thresholds at 2 and 4 KHz. It deals specifically with subjects presenting a wide scale of NIHL, with a well-documented and quantified noise exposure and seeking for compensation. Moreover, the data (in the small as well as in the large dataset) may be considered as fully reliable, since they were checked with an objective technique.
The data showed a good correlation between the 2 – 4 KHz intrapolation and the actual 3 KHz threshold, indicating that for epidemiological studies with large amounts of data, the intrapolated threshold may be considered as a valid estimate of the true value; the error may be around 2 dB on average.
Much more caution is required in an individual case. The data demonstrated that the error due to intrapolation exceedd 5 dB HL in about one quarter of the cases. This error is predictable; the larger the 2 – 4 KHz difference (which reflects the steepness of the left slope of the audiometric notch), the larger the error (on either side) made by intrapolating.
Conflict of interest
The authors declare that there is no conflict of interest.
Acknowledgment
The present study received no specific grant from any funding agency, commercial or non-profit sectors. It is a non-interventional, retrospective analysis of existing data obtained from previous audiological investigations. The authors thank the Federal Agency for Occupational Risks for making possible this study based on strictly anonymized data, according to the standard rules and procedures applicable for scientific studies within Fedris.
Authors Contribution
P.H. DeJonckere : Conceptualization ; methodology ; investigation ; writing (original draft) ; writing (review & editing)
J. Lebacq : Conceptualization ; methodology ; investigation ; writing (original draft) ; writing (review & editing).
References
1. AMA Guides to the Evaluation of Permanent Impairment, 6th ed. American Medical Association; 2021. Doi: 10.1001/978-1-64016-208-2
2.Colucci, D. AMA Hearing Loss/Tinnitus Guidelines. The Hearing Journal. 2016; 69(2): 40. Doi: 10.1097/01.HJ.0000480890.25214.bb
3. Gurgel RK, Popelka GR, Oghalai JS, Blevins NH, Chang KW, Jackler RK. Is it valid to calculate the 3-kilohertz threshold by averaging 2 and 4 kilohertz? Otolaryngol Head Neck Surg. 2012; 147(1): 102-104. Doi: 10.1177/0194599812437156.
4. Neitzel R, Fligor B. Risk of noise-induced hearing loss due to recreational sound: Review and recommendations. Journal of the Acoustical Society of America. 2019; 146. 3911-3921. Doi: 10.1121/1.5132287
5. ACGIH. Audible sound: Threshold Limit Value physical agents documentation. 7th ed. Cincinnati, OH. 2018.6. Fowler EP. Limited lesions of the basilar membrane. Archives of Otolaryngology-head & Neck Surgery 1929; 10: 624- 632. Doi:10.1001/ARCHOTOL
7. Perez R, Gatt N, Cohen D. Audiometric configurations explosion following exposure to explosions. Arch Otolaryngol Head Neck Surg. 2000; 126: 1249 –1252.
8. Ziv M, Philipsohn NC, Leventon G, Man A. Blast injury of the ear: treatment and evaluation. Mil Med. 1973; 138: 811-813.
9. Berger EH & al., editors. The Noise Manual, revised 5th edition, edited by E.H. Berger, L.H. Royster, J.D. Royster, D.P. Driscoll, and M. Layne: American Industrial Hygiene Association; 2003.
10. Dobie RA, Rabinowitz PM. Change in audiometric configuration helps to determine whether a STS is work-related. Spectrum 2002; 19:17.
11. Lutman ME, Coles RRA, Buffin JT. Guidelines for quantification of noise-induced hearing loss in a medicolegal context. Clinical Otolaryngology 2016;41(4):347–57. Doi:10.1111/coa.12569
12. King PF, Coles RRA, Lutman ME, Robinson DW. Assessment of Hearing Disability: Guidelines for Medicolegal Practice. London John Wiley and Sons Ltd. 1992.
13. Mazlan AN, Yahya K. Compensation Process for Noise Induced Hearing Loss. Jurnal Teknologi. 2015;74 (4):13-7.
14. DeJonckere PH, Lebacq, J. The comparison of auditory behavioral and evoked potential responses (steady state and cortical) in subjects with occupational noise-induced hearing loss, Journal of Otology. 2021;16:242–51.
15. DGUV. Empfehlung für die Begutachtung der Lärmschwerhörigkeit (BK-Nr. 2301) – Königsteiner Empfehlung – Update 2020. Deutsche Gesetzliche Unfallversicherung e.V. (DGUV) Berlin; 2020.
16. Tenorio GA, Ferrite S, Teive e Argollo Dultra P. Summary Estimate of the differential between pure-tone and click ABR Thresholds in normal healing adults. International Archives of Otorhinolaryngology. 2007; 11: 54-59.
17. Kim JM, Na MS, Jung KH, Lee SH, Han JS, Lee OH, Park SY. The Best-Matched Pure Tone Average and Speech Recognition Threshold for Different Audiometric Configurations. Korean Journal of Otorhinolaryngology-Head and Neck Surgery. 2016 ; 59(10) : 725-729. doi: https://doi.org/10.3342/kjorl-hns.2016.59.10.725
18. Nyarubeli, IP, Bråtveit, M, Tungu, AM, Mamuya, SH and Moen, BE, 2021. Temporary Threshold Shifts among Iron and Steel Factory Workers in Tanzania: A Pre- Interventional Study. Annals of Global Health. 2021; 87(1): 35, 1 - 11. DOI: http://doi.org/10.5334/ aogh.3193
19. Monsell EM. New and revised reporting guidelines from the Committee on Hearing and Equilibrium. Otolaryngol Head Neck Surg. 1995; 113: 176 – 178.
20. Gurgel RK, Jackler RK, Dobie RA, Popelka GR. A new standardized format for reporting hearing outcome in clinical trials. Otolaryngol Head Neck Surg. 2012 ; 147(5) : 803-807.
21. Kim JY, Byun SW, Shin SH, Chun MS. Can an average of thresholds at 2 kHz and 4 kHz substitute for the threshold at 3 kHz in pure tone audiometry? A study based on the Korean National Health and Nutrition Examination Survey 2010–2012. PLoS ONE 13(8):e0201867. https://doi.org/10.1371/journal.pone.0201867. August 7, 2018. 10 pp.
22. Heo SD, Lee JM, Park JS, Choi A H, Kang MK. Evaluation of exaggerated hearing loss using objective audiometry. Korean Journal of Communication Disorders. 2008; 13 (3): 513 - 523.
23. DeJonckere, P.H., Van Dessel, F., De Granges de Surgères, G., Coryn C. Definition of frequency-specific hearing thresholds in subjects exaggerating their noise-induced hearing loss, in: Claussen, CF, Kirtane, MV, Schneider, D (Eds.) Proceedings NES Vol. 20; 1992: Dr Werner Rudat & Co, m+p edition Hamburg; 1992 p. 309 - 319.
24. DeJonckere, P H, Coryn, C, Lebacq, J. Cortical evoked response audiometry thresholds and neuroleptic, sedative, hypnotic drugs. Int. Tinnitus J. 2000; 6 : 25-28.
25. DeJonckere, P. H., Coryn, C., Lebacq, J. Experience with a medicolegal decision-making system for occupational hearing loss-related tinnitus. Int Tinnitus J. 2009; 15: 185-192.
26. DeJonckere, P.H., Coryn, C.. A comparison between middle latency responses and late auditory evoked potentials for approximating frequency-specific hearing levels in medicolegal patients with occupational hearing loss. Int. Tinnitus J. 2000; 6 : 175-81.
27. DeJonckere, P.H., Lebacq, J. Medicolegal decision making in noise-induced hearing loss-related tinnitus. Int. Tinnitus J. 2005 ; 11 : 92-96.
28. DeJonckere, P. H. Medicolegal decision making in noise-induced hearing loss-related tinnitus. In: Fayez Bahmad Jr, editor. Up to date on tinnitus. InTech, Rijeka, Croatia; 2011. p. 101 – 114.
29. DeJonckere P.H., Millet B., Van Gool R., Martens, A., Lebacq, J., 2021. Objective frequency-specific hearing thresholds definition for medicolegal purposes in case of occupational NIHL: ASSR outperforms CERA. Journal of Otology. 2021; 16: 210-219. https://doi.org/10.1016/j.joto.2021.02.002
30. Cohen, J. Statistical Power Analysis for the Behavioral Sciences. New York, NY: Routledge Academic: 1988.
31 McLeod, SA. What does effect size tell you? Simply psychology: https://www.simplypsychology.org/effect-size.html 2019, July 10, 2021.
32. Portney LG, Watkins MP. Foundations of Clinical Research. Applications and Practice. Norwalk: Appleton & Lange; 1993 : 509–516. ISBN 0-8385-1065-5.
33. Liljequist D, Elfving B, Roaldsen KS. Intraclass correlation – A discussion and demonstration of basic features. PlosOne 2019; 14 (7): e0219854. http://doi.org/10.1371/journal.pone.0219854.
34. Zeller R. Measurement error issues and solutions in : Encyclopedia of Social measurement Elsevier 2005 ; vol. 2 : 665 – 676. https://doi.org/10.1016/B0-12-369398-5/00109-2.
35. Panayides P Coefficient Alpha: Interpret With Caution. Europe's Journal of Psychology, 2013, Vol. 9(4), 687–696, doi:10.5964/ ejop.v9i4.653 . https://www.real-statistics.com/ reliability/internal-consistency-reliability/cronbachs-alpha/cronbachs-alpha-basic-concepts/ ).
36. Bland JM, Altman DG. Statistical method for assessing agreement between two methods of clinical measurement. The Lancet 1986; 327 : 307-310. https://doi.org/10.1016/S0140-6736(86)90837-8
37. Bland JM, Altman DG. Measuring agreement in method comparison studies. Statistical Methods in Medical Research. 1999; 8 (2) : 135 - 160. DOI: 10.1177/096228029900800204
38. Wilson RH, McArdle R. Characteristics of the audiometric 4,000 Hz notch (744.553 veterans) and the 3,000, 4,000, and 6,000 Hz notches (539,932 veterans). J Rehabil Res Dev. 2013 ; 50(1) : 111–132. http://dx.doi.org/10.1682/JRRD.2011.11.0225.
39. Feng L, Monvadi BS, Lim RP, Harrison A, King W, Adluru G, Dibella EVR, Sodickson DK, Otazo R, Kim D. Highly-Accelerated Real-Time Cardiac Cine MRI Using k-t SPARSE-SENSE. Magn Reson Med. 2013 ; 70(1): 64–74. doi:10.1002/mrm.24440.
40. ISO 1999 Acoustics: Estimation of Noise-Induced Hearing Loss. International Organization for Standardization, Geneva; 2013.
41. OSHA Occupational Injury and Illness Recording and Reporting Requirements - Final Rule. Washington DC; 2002. https://www.osha. gov/laws-regs/federalregister/2002-07-01-1.
Type of Study: Research |
Subject:
Special
Received: 2021/07/15 | Accepted: 2022/02/6 | Published: 2022/02/14
Received: 2021/07/15 | Accepted: 2022/02/6 | Published: 2022/02/14
Send email to the article author
| Rights and permissions | |
 |
This work is licensed under a Creative Commons Attribution-NonCommercial 4.0 International License. |