

Volume 6, Issue 1 (January 2022)
AOH 2022, 6(1): 1198-1205 |
Back to browse issues page

![]()
![]()
![]()
Download citation:
BibTeX | RIS | EndNote | Medlars | ProCite | Reference Manager | RefWorks
Send citation to:


BibTeX | RIS | EndNote | Medlars | ProCite | Reference Manager | RefWorks
Send citation to:
Mohammadi H, Fazli Z, Taheri Pour M, Moradi Hanifi S. Modeling of Pool Fire Risk in a Chemical Warehousese. AOH 2022; 6 (1) :1198-1205
URL: http://aoh.ssu.ac.ir/article-1-275-en.html
URL: http://aoh.ssu.ac.ir/article-1-275-en.html


1- epartment of Occupational Health and Safety, School of Health, Larestan University of Medical Sciences, Larestan, Iran
2- 2Department of Occupational Health Engineering, School of Public Health, Bam University of Medical Sciences, Bam, Iran
3- Department of environmental Islamic Azad University, Tehran, Iran
4- Health Reseach center, Life style Institute, Baqiyatallah University of Medical Sciences, Tehran, Iran
2- 2Department of Occupational Health Engineering, School of Public Health, Bam University of Medical Sciences, Bam, Iran
3- Department of environmental Islamic Azad University, Tehran, Iran
4- Health Reseach center, Life style Institute, Baqiyatallah University of Medical Sciences, Tehran, Iran
Full-Text [PDF 2278 kb]
(211 Downloads)
| Abstract (HTML) (781 Views)
ne of the accidents in a chemical warehouse is the damage caused by the chemical leakage and the subsequent pool fire. Pool fire is usually the turbulent spreading of fire over a horizontal pool of evaporating flammable materials. However, flammable materials have an initial momentum equal to or less than zero. Pool fires usually occur in jet fuels, diesel engines, hydrocarbons (heavier than hexane), glycols, and hydraulic oils and fluids. 1 Previous studies have shown that pool fire is one of the most common accidents in the hazardous materials processing and transportation industries. 2 There have been numerous incidents of pool fire, such as Buncefield, in the UK (2005), Puerto Rico, USA (2009), Sitapura, India (2009), and Bucheon LPG Filling Station, Korea (1998). 3 Concerns about the probability of such accidents have led to laws and regulations to quantify their risk. 2
Many methods have been proposed for assessing fire risk, designing fire protection systems, and reducing the fire risk. 4 According to a report by the International Association of Oil and Gas Producers, fire risks can be assessed in two ways of analytical relationships and modeling methods with CFD. 5 Point source and solid flame models are among the analytical models. The point source model does not take into account the shape of the flame, and assumes that the heat flux originates from a point source. This model usually estimates the heat flux more than its actual value. In addition, large pool fires with smoke do not take into account the effect and direction of wind, 6 however, at 10 times the radius of the fire center, it gives favorable results. 1 Solid flame models assume that the flame is solid in shape, emits heat only from its outer surface, calculates the heat flux as a function of the surface flame's propagating power and shape, and obtains air permeability coefficients. These models are simple to operate, and can provide favorable results. 1 The most important limitation of this model is that it does not include accurate predictions of pool fire behavior in complex geometries. 7
Field models or CFD models are based on the numerical solution of partial differential equations of Navier-Stokes. These models need to be evaluated by experimental or real data. Major drawbacks of these methods are the long computational time, the difficulty of programming, and incompatibility with many applications. However, with rapid development of computer programs and the development of codes for fire assessment, the results of these models are more accurate than experimental methods. 7, 8One of these codes is FDS. This code shows a time resolution which can provide important information in evaluating potential situations. 9
FDS is a CFD code designed to simulate the flow of fluids containing fire. This software numerically solves the Navier-Stokes equations for low-speed heat flows, and also simulates heat transfer and smoke from fire. 10 Henrik and Partners in 2007 studied the sensitivity of FDS code for software inputs, such as physical parameters (including heat release rate, fire geometry, fire position, fuel type, indoor and outdoor temperature, room dimensions) and program parameters (such as Smagorinsky radiation and constant model). 11 The phenomena, such as thermal instability in finite and infinite flows in pool fires have been studied in labs by Wickman and Sobiesiak, 12 Cetegen and Ahmed13, and Finney
et al. . 14
This study aimed to evaluate the effects of pool fire on chemical warehouses. Numerous studies have been carried out in warehouses, including studies on fire risk management, 15 layout of warehouse architecture, fire extinguishing systems, fire-resistant structures 16-19 process of fire and smoke spread 20, 21 and fire alarm systems. 17 Using this code, the impact of heat radiation on humans and materials in the warehouse can be estimated, and accordingly, appropriate preventive measures can be taken. In this study, the FDS code was used to simulate anti-icing of pool fire in a chemical warehouse.
Methods
Numerical simulations in this study were performed using Computational Fluid Dynamics (CFD) code FDS 6.5.1. In order to evaluate the validity of the results, the CFD results were compared with the results of solid flame analytical model. The stages are discussed below.
1- Fire Modeling Using FDS
The amount of heat generated by the pool fire is different at various time intervals, the lifetime of which can be divided into three phases, including growth phase, steady phase, and decay phase. 22 The steady phase is generally the most important and the longest in the lifetime of the pool fire, and the heat flux value can be assumed to be stable in this phase with little error. 23, 24 In pool fire modeling, the first step is to obtain the heat generated by fire. To this end, empirical equations and numerical simulations were used. 25 This software numerically solves Navier-Stokes equations for low-velocity heat flows, and also simulates heat transfer and fire smoke motion. Smokview software is a companion application of FDS software designed to produce fire simulation images and animations. 26
2- Solid Flame Model
This model assumes that the flame has a solid shape, from the surface of which the heat flux is emitted. In this model, the smoke plume radiation (invisible flame) over the fire is partially taken into account in the calculations. In fact, most models consider the maximum flame length rather than the average, which also includes the volume of smoke over the flame. The shape of the flame depends on the fire characteristics. In the case of pool fire, if the pool is circular, the fire will be approached as a cylinder. If a rectangular basin contains liquid fuel, the fire will be considered a parallelepiped cube. 24 It is generally assumed that energy is uniformly emitted from the entire surface of the flame. 1 The coefficient of vision is defined as the fraction of radiation which reaches the surface unit at the receiving end. Figure 1 considers the flame a tilted cylinder. Using equation 1, the heat flux intensity received can be calculated. 1
(1).JPG)
3- Boundary Conditions
In this study, all surfaces (up, down, walls) were considered adiabatic. The barrels containing these materials were metal and the capacity of each barrel was 0.22 m 3 (height 0.85 m and diameter 0.37 m). The anti-icing barrels were arranged in quadruple pallets, which a total of 4 pallets stacked in two rows were evaluated. Table 1 shows the input parameters in anti-icing of pool simulation.
4- Fire Risk Modeling
Fire has many broad consequences in process industries. The simplest way to define the effects of heat flux is studying the heat generated by the surface flame. Stephen Boltzmann's equation can be used to estimate the initial heat flux value (equation 2). This equation cannot represent the actual amount of heat flux, since the surface temperature of the flame varies along the flame, and there is no unit temperature to be determined. Furthermore, the flame does not radiate from its entire surface; for part of it is covered with soot, and much of the heat flux is absorbed by carbon dioxide and atmospheric moisture. Therefore, the heat flux calculated by this equation is significantly higher than the actual heat flux. Several methods have been developed for accurate heat flux evaluation, such as point source model, solid flame model, field model, integral, and zone models. 24, 29 In this study, computational fluid dynamics methods were used.
(2).JPG)
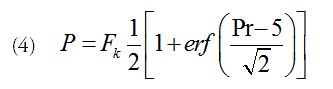
For calculating probability, injury (first or second degree burn) or death, as a consequence of the specified dose, equations 3 and 4 were used. 1, 30
.JPG)
Heat radiation dose was used to determine the number of burns and deaths depending on the radiation heat flux and its exposure time, which was calculated using equation 5. 24
.JPG)
The individual's exposure time is usually equal to the sum of the initial reaction time plus the time required to reach a safe point determined by equation 6. 24

The reaction time is considered 5 seconds. is the distance between the surface flame and the position at which the heat flux intensity is less than 1 kW/m. 2 u is the escape speed (usually 4 m/s).
Fk refers to the impact of clothing on the probability of injury or death, and assuming no combustion occurs under the clothes, it is a correction factor. Its value varies from 0.14 for winter clothing, and 0.95 for summer clothing. In this study, it is considered to be 0.95 for summer clothes. The coefficients C1 and C2 are constant values determined by table 2. 1
5- Modeling the Impacts on Materials inside the Warehouse
Damage to materials caused by heat flux can be divided into two categories, depending on the impacts observed, which includes: First-degree burn (complete destruction of materials), second- degree burn (surface, damage to the visible part of materials). The criterion for this damage is the surface temperature of the material under investigation. When the surface temperature exceeds a critical temperature (Tcrit), then first- or second-degree burn is observed. 1 In this study, given the barrel containing anti-icing was made of iron, the critical temperature was considered 496.8C for the first-degree, and 196.8C for the second-degree burn. 31
Results
1- Fire Modeling
In this study, structured meshes and time step 10-2 were used. Simulation was performed using a 64cores / CPU E5 -2690 V4@2.6 GHz (2processors) and 32 GB memory system, in the Shahid Beheshti University of Medical Sciences, Tehran, Iran. The results were analyzed based on the heat flux obtained at the receiving point. The results of this comparison are shown in table 3, and figure 1 presents the development of the pool fire in second 20.
2- Numerical Gridding
In this study, three different mesh sizes (0.04, 0.0625, 0.08) were investigated and compared with analytical models. Figure 2 shows the results of the comparison between the values predicted by the simulation and the values obtained from the analytical models.
Table 1. Input Parameters of Anti-icing of Pool Fire Simulation
Table 2. C1 and C2 Coefficients31
Table 3. Comparison of CFD Simulation Results with Analytical Models
.JPG)
Figure 1. Development of Pool Fire in Second 20
.JPG)
Figure 2. Comparison of Results between the Values Predicted by the Simulation, and the Values Obtained from the Analytical Models
.JPG)
Figure 3. Probability of Impacts on Humans in CFD Method and Solid Flame Model
.JPG)
Figure 4. Temperature Distribution Resulting from Pool Fire in a Chemical Warehouse
Full-Text: (440 Views)
Modeling of Pool Fire Risk in a Chemical Warehouse
1Department of Occupational Health and Safety, School of Health, Larestan University of Medical Sciences, Larestan, Iran• 2Department of Occupational Health Engineering, School of Public Health, Bam University of Medical Sciences, Bam, Iran• 3 Department of environmental Islamic Azad University, Tehran, Iran• 4 Health Reseach center, Life style Institute, Baqiyatallah University of Medical Sciences, Tehran, Iran• * Corresponding Author: Saber Moradi Hanifi, Email: sabermoradi22@yahoo.com
ABSTRACT
Background: Pool fire is a phenomenon caused by the leakage of flammable materials on the ground leading to serious hazards, irrespective of its consequences. The proximity and high volumes of chemicals in warehouses require that the characteristics of various materials in warehouses be taken into account for calculating the chain effects of the pool fire. Methods: One of the effective parameters in expanding the impact of the pool fire chain is heat flux value. There are different models for calculating and predicting it. In this study, two approaches of computational fluid dynamic (CFD), fire-driven fluid flow, fire dynamics simulator (FDS), and solid flame model were used to predict heat flux values. Results: In both models, the calculated heat flux was used to evaluate the effects on humans (first-degree burns, second-degree burns, and deaths) and the materials. The CFD results were compared with the results of the solid flame model, which indicated that there was little error in the predicted heat flux values. Conclusion: The results of this study can be used to better understand the effects of pool fire on chemical warehouses, and provide appropriate control measures to prevent such accidents in warehouses.
Keywords: Fire risk modeling; Pool fire; Chemical warehouse; CFD; FDS
Introduction
Heidar Mohammadi 1, Zohreh Fazli 2, Masoud Taheri Pour 3, Saber Moradi Hanifi 4*
1Department of Occupational Health and Safety, School of Health, Larestan University of Medical Sciences, Larestan, Iran• 2Department of Occupational Health Engineering, School of Public Health, Bam University of Medical Sciences, Bam, Iran• 3 Department of environmental Islamic Azad University, Tehran, Iran• 4 Health Reseach center, Life style Institute, Baqiyatallah University of Medical Sciences, Tehran, Iran• * Corresponding Author: Saber Moradi Hanifi, Email: sabermoradi22@yahoo.com
ABSTRACT
Background: Pool fire is a phenomenon caused by the leakage of flammable materials on the ground leading to serious hazards, irrespective of its consequences. The proximity and high volumes of chemicals in warehouses require that the characteristics of various materials in warehouses be taken into account for calculating the chain effects of the pool fire. Methods: One of the effective parameters in expanding the impact of the pool fire chain is heat flux value. There are different models for calculating and predicting it. In this study, two approaches of computational fluid dynamic (CFD), fire-driven fluid flow, fire dynamics simulator (FDS), and solid flame model were used to predict heat flux values. Results: In both models, the calculated heat flux was used to evaluate the effects on humans (first-degree burns, second-degree burns, and deaths) and the materials. The CFD results were compared with the results of the solid flame model, which indicated that there was little error in the predicted heat flux values. Conclusion: The results of this study can be used to better understand the effects of pool fire on chemical warehouses, and provide appropriate control measures to prevent such accidents in warehouses.
Keywords: Fire risk modeling; Pool fire; Chemical warehouse; CFD; FDS
| Nomenclature | |||
| I | intensity of the thermal radiation reaching a given target (kW m-2) | grey-body emissivity | |
| atmospheric transmissivity | Stefan-Boltzmann'sconstant (5.6703x10⁻⁸ W m-2K-4) | ||
| F | the view factor | temperature at the surface flame(K) | |
| E | average emissive power of the flames (kW m-2) | probit function | |
| Q | heat release rate (kW) | constant coefficients | |
| fuel mass burning rate per unit surface and per unit time (kg m-2 s-1) | constant coefficients | ||
| Heat of vaporization (kJ kg-1 ) | thermal radiation dose (W4/3sm-8/3) | ||
| Heat of combustion (kJ mole-1 or kJ kg-1 ) | probability | ||
| specific heat at constant pressure (kJ kg-1 K-1) | erf | error function | |
| boiling temperature at atmospheric pressure (K) | influence of clothes | ||
| ambient temperature (K) | exposure time(s) | ||
| characteristic fire diameter (m | person's reaction time(s) | ||
| density (kg/m3) | distance between the flame's surface and the position(m) | ||
| T | temperature (K) | distance of the person from the surface of the flame(m) | |
| g | gravitational acceleration (m/s2) | u | escape velocity(ms-1) |
| heat flux (kW/m2) | root-mean-square error | ||
| O |
Many methods have been proposed for assessing fire risk, designing fire protection systems, and reducing the fire risk. 4 According to a report by the International Association of Oil and Gas Producers, fire risks can be assessed in two ways of analytical relationships and modeling methods with CFD. 5 Point source and solid flame models are among the analytical models. The point source model does not take into account the shape of the flame, and assumes that the heat flux originates from a point source. This model usually estimates the heat flux more than its actual value. In addition, large pool fires with smoke do not take into account the effect and direction of wind, 6 however, at 10 times the radius of the fire center, it gives favorable results. 1 Solid flame models assume that the flame is solid in shape, emits heat only from its outer surface, calculates the heat flux as a function of the surface flame's propagating power and shape, and obtains air permeability coefficients. These models are simple to operate, and can provide favorable results. 1 The most important limitation of this model is that it does not include accurate predictions of pool fire behavior in complex geometries. 7
Field models or CFD models are based on the numerical solution of partial differential equations of Navier-Stokes. These models need to be evaluated by experimental or real data. Major drawbacks of these methods are the long computational time, the difficulty of programming, and incompatibility with many applications. However, with rapid development of computer programs and the development of codes for fire assessment, the results of these models are more accurate than experimental methods. 7, 8One of these codes is FDS. This code shows a time resolution which can provide important information in evaluating potential situations. 9
FDS is a CFD code designed to simulate the flow of fluids containing fire. This software numerically solves the Navier-Stokes equations for low-speed heat flows, and also simulates heat transfer and smoke from fire. 10 Henrik and Partners in 2007 studied the sensitivity of FDS code for software inputs, such as physical parameters (including heat release rate, fire geometry, fire position, fuel type, indoor and outdoor temperature, room dimensions) and program parameters (such as Smagorinsky radiation and constant model). 11 The phenomena, such as thermal instability in finite and infinite flows in pool fires have been studied in labs by Wickman and Sobiesiak, 12 Cetegen and Ahmed13, and Finney
et al. . 14
This study aimed to evaluate the effects of pool fire on chemical warehouses. Numerous studies have been carried out in warehouses, including studies on fire risk management, 15 layout of warehouse architecture, fire extinguishing systems, fire-resistant structures 16-19 process of fire and smoke spread 20, 21 and fire alarm systems. 17 Using this code, the impact of heat radiation on humans and materials in the warehouse can be estimated, and accordingly, appropriate preventive measures can be taken. In this study, the FDS code was used to simulate anti-icing of pool fire in a chemical warehouse.
Methods
Numerical simulations in this study were performed using Computational Fluid Dynamics (CFD) code FDS 6.5.1. In order to evaluate the validity of the results, the CFD results were compared with the results of solid flame analytical model. The stages are discussed below.
1- Fire Modeling Using FDS
The amount of heat generated by the pool fire is different at various time intervals, the lifetime of which can be divided into three phases, including growth phase, steady phase, and decay phase. 22 The steady phase is generally the most important and the longest in the lifetime of the pool fire, and the heat flux value can be assumed to be stable in this phase with little error. 23, 24 In pool fire modeling, the first step is to obtain the heat generated by fire. To this end, empirical equations and numerical simulations were used. 25 This software numerically solves Navier-Stokes equations for low-velocity heat flows, and also simulates heat transfer and fire smoke motion. Smokview software is a companion application of FDS software designed to produce fire simulation images and animations. 26
2- Solid Flame Model
This model assumes that the flame has a solid shape, from the surface of which the heat flux is emitted. In this model, the smoke plume radiation (invisible flame) over the fire is partially taken into account in the calculations. In fact, most models consider the maximum flame length rather than the average, which also includes the volume of smoke over the flame. The shape of the flame depends on the fire characteristics. In the case of pool fire, if the pool is circular, the fire will be approached as a cylinder. If a rectangular basin contains liquid fuel, the fire will be considered a parallelepiped cube. 24 It is generally assumed that energy is uniformly emitted from the entire surface of the flame. 1 The coefficient of vision is defined as the fraction of radiation which reaches the surface unit at the receiving end. Figure 1 considers the flame a tilted cylinder. Using equation 1, the heat flux intensity received can be calculated. 1
(1)
3- Boundary Conditions
In this study, all surfaces (up, down, walls) were considered adiabatic. The barrels containing these materials were metal and the capacity of each barrel was 0.22 m 3 (height 0.85 m and diameter 0.37 m). The anti-icing barrels were arranged in quadruple pallets, which a total of 4 pallets stacked in two rows were evaluated. Table 1 shows the input parameters in anti-icing of pool simulation.
4- Fire Risk Modeling
Fire has many broad consequences in process industries. The simplest way to define the effects of heat flux is studying the heat generated by the surface flame. Stephen Boltzmann's equation can be used to estimate the initial heat flux value (equation 2). This equation cannot represent the actual amount of heat flux, since the surface temperature of the flame varies along the flame, and there is no unit temperature to be determined. Furthermore, the flame does not radiate from its entire surface; for part of it is covered with soot, and much of the heat flux is absorbed by carbon dioxide and atmospheric moisture. Therefore, the heat flux calculated by this equation is significantly higher than the actual heat flux. Several methods have been developed for accurate heat flux evaluation, such as point source model, solid flame model, field model, integral, and zone models. 24, 29 In this study, computational fluid dynamics methods were used.
(2)
For calculating probability, injury (first or second degree burn) or death, as a consequence of the specified dose, equations 3 and 4 were used. 1, 30
Heat radiation dose was used to determine the number of burns and deaths depending on the radiation heat flux and its exposure time, which was calculated using equation 5. 24
The individual's exposure time is usually equal to the sum of the initial reaction time plus the time required to reach a safe point determined by equation 6. 24
The reaction time is considered 5 seconds.
Fk refers to the impact of clothing on the probability of injury or death, and assuming no combustion occurs under the clothes, it is a correction factor. Its value varies from 0.14 for winter clothing, and 0.95 for summer clothing. In this study, it is considered to be 0.95 for summer clothes. The coefficients C1 and C2 are constant values determined by table 2. 1
5- Modeling the Impacts on Materials inside the Warehouse
Damage to materials caused by heat flux can be divided into two categories, depending on the impacts observed, which includes: First-degree burn (complete destruction of materials), second- degree burn (surface, damage to the visible part of materials). The criterion for this damage is the surface temperature of the material under investigation. When the surface temperature exceeds a critical temperature (Tcrit), then first- or second-degree burn is observed. 1 In this study, given the barrel containing anti-icing was made of iron, the critical temperature was considered 496.8C for the first-degree, and 196.8C for the second-degree burn. 31
Results
1- Fire Modeling
In this study, structured meshes and time step 10-2 were used. Simulation was performed using a 64cores / CPU E5 -2690 V4@2.6 GHz (2processors) and 32 GB memory system, in the Shahid Beheshti University of Medical Sciences, Tehran, Iran. The results were analyzed based on the heat flux obtained at the receiving point. The results of this comparison are shown in table 3, and figure 1 presents the development of the pool fire in second 20.
2- Numerical Gridding
In this study, three different mesh sizes (0.04, 0.0625, 0.08) were investigated and compared with analytical models. Figure 2 shows the results of the comparison between the values predicted by the simulation and the values obtained from the analytical models.
Table 1. Input Parameters of Anti-icing of Pool Fire Simulation
| Parameter | value |
| Fuel | anti-icing C5H12O3 |
| Pool diameter (m) | 2.5 |
| Combustion heat (Kj / Kg) 27 | 25083 |
| HRR(Kw/m2) | 903 |
| Density (kg/m3) | 1020 |
| Radiative fraction 28 | 0.35 |
| Ambient temperature (K) | 294 |
| Burning rate (kg/m2.s) | 0.073 |
| Domain size Fire filed (m) | 16×34×6 |
| Domain size Far filed (m) | 24×55×6 |
| Total simulation time (s) | 300 |
| Grid resolution (R) | 4, 6/2, 8/2 |
| Effect | C1 | C2 |
| First-degree burn | -39.83 | 3.0186 |
| Second-degree burn | -43.14 | 3.0186 |
| Death | -36.38 | 3.56 |
| Distance | Heat flux (kw/m2) | |||
| FDS | Solid flame model | |||
| R=8 | R=6 | R=4 | ||
| Y/D=0.4 | 22.8 | 19.5 | 41.2 | 22.79 |
| Y/D=1.5 | 5.7 | 5.22 | 3.89 | 10.89 |
| Y/D=2.2 | 3.41 | 2.7 | 2.62 | 7.63 |
Figure 1. Development of Pool Fire in Second 20
Figure 2. Comparison of Results between the Values Predicted by the Simulation, and the Values Obtained from the Analytical Models
Figure 3. Probability of Impacts on Humans in CFD Method and Solid Flame Model
Figure 4. Temperature Distribution Resulting from Pool Fire in a Chemical Warehouse
3. Modeling of the Impacts on Humans
Figure 3 shows the damage probability of numerical simulation and solid flame model.
4. Modeling of the Impacts on Materials
Figure 4 shows the effect of temperature on the adjacent barrels of chemicals and warehouse building. In this scenario, the maximum temperature is 970 ° C.
Discussion
As can be seen, the maximum probability of death based on the solid flame model results, was at a distance of 1.5 meters, and the maximum safety distance was at 3 meters, whereas the CFD model predicted a maximum safety distance of 3.5 meters. Therefore, it can be concluded that due to the exposure time, the range of vulnerability based on these two models is 1.5 to 5.5 meters from the fire. The CFD model revealed that at a distance of 1 m from the fire, the heat flux was 100Kw/m2, which gradually decreased to 3.5 meters. CFD predicted the maximum safety distance of 3 meters for heat flux exceeding 12.5Kw/m2, while solid flame model predicted it to be approximately 5 meters. Studies have shown that heat fluxes below 25Kw/m2 can have the following effects: 1% death in 1 minute of exposure and first degree burns in 10 seconds of exposure. 29
The adjacent barrels were made of iron. The critical temperature of iron was 496.8C for the first -degree burn, and 196.8C for the second-degree burn. Due to the critical temperature of the adjacent equipment, it is expected that the walls of adjacent chemical barrels less than 4 meters away from the fire would cause an error, leading to a fire domino. The FDS used one-dimensional thermal conductivity to obtain this temperature. The FDS assumes that thermal conductivity is performed from a normal surface. Since the surface of the barrels containing chemicals is cylindrical, heat conduction is carried out on both sides. As a result, a uniform temperature distribution simulates the barrel surface, which in these conditions can provide more accurate results with real
scenarios. 29 CFD simulation of pool fire in a chemical warehouse was performed using FDS 6.5.1 code.
Conclusion
The results of their impacts can be better understood by the simulation of fire in chemical warehouses, the conclusions of which are as
follows:
Conflict interest
The authors have declared that there is no conflict of interest.
Authors Contribution
All authors contributed to the final version of the manuscript, equally.
Acknowledgment
This study is part of a Ph.D. dissertation which was funded by Shahid Beheshti University of Medical Sciences, Tehran. Iran. The authors wish to appreciate Shahid Beheshti University of Medical Sciences for their financial and technical support. The proposal was approved by the ethics committee prior to its execution (Project No:9497/20).
References
1. Assael MJ, Kakosimos KE. Fires, explosions, and toxic gas dispersions: effects calculation and risk analysis: CRC Press; 2010.
2. Muñoz M, Arnaldos J, Casal J, Planas E. Analysis of the geometric and radiative characteristics of hydrocarbon pool fires. Combustion and Flame. 2004;139(3):263-77.
3. Mishra KB, Wehrstedt K-D, Krebs H. Lessons learned from recent fuel storage fires. Fuel processing technology. 2013;107:166-72.
4. Directorate HI. Fire, Explosion and Risk Assessment Topic Guidance.
5. (2010).
6. Raj PK. LNG fires: A review of experimental results, models and hazard prediction challenges. Journal of hazardous materials. 2007;140(3):444-64.
7. Sun B, Guo K, Pareek VK. Computational fluid dynamics simulation of LNG pool fire radiation for hazard analysis. Journal of Loss Prevention in the Process Industries. 2014;29:92-102.
8. Hansen OR, Davis SG, Gavelli F, Richardson J, editors. Benefits of CFD for onshore facility explosion studies. 8th Global Congress on Process Safety; 2012.
9. Suardin JA, McPhate Jr AJ, Sipkema A, Childs M, Mannan MS. Fire and explosion assessment on oil and gas floating production storage offloading (FPSO): an effective screening and comparison tool. Process safety and environmental protection. 2009;87(3):147-60.
10. Sellami I, Manescau B, Chetehouna K, de Izarra C, Nait-Said R, Zidani F. BLEVE fireball modeling using Fire Dynamics Simulator (FDS) in an Algerian gas industry. Journal of Loss Prevention in the Process Industries. 2018;54:69-84.
11. Brohus H, Nielsen PV, Petersen AJ, Sommerlund-Larsen K, editors. Sensitivity analysis of fire dynamics simulation. Proceedings of Roomvent; 2007: Citeseer.
12. Weckman E, Sobiesiak A, editors. The oscillatory behaviour of medium-scale pool fires. Symposium (International) on Combustion; 1989: Elsevier.
13. Cetegen BM, Ahmed TA. Experiments on the periodic instability of buoyant plumes and pool fires. Combustion and flame. 1993;93(1-2):157-84.
14. Finney MA, Forthofer J, Grenfell IC, Adam BA, Akafuah NK, Saito K. Section B Fire and Explosion-A Study of Flame Spread in Engineered Cardboard Fuel Beds Part I: Correlations and Observations of Flame Spread. Progress in Scale Modeling, Volume II: Springer; 2015. p. 71-83.
15. Liu X, Li J, Li X. Study of dynamic risk management system for flammable and explosive dangerous chemicals storage area. Journal of Loss Prevention in the Process Industries. 2017;49:983-8.
16. Tan Y, Li J, Li Y, Huang Y. Study on the response of sprinkler system in logistics warehouse under the influence of the hollow floorboard. Case Studies in Thermal Engineering. 2019;14:100427.
17. Xiang-ning L, Detachment CF. Application of fire detection and alarm system in logistics distribution center. Fire Science and Technology. 2016(11):30.
18. Wei X. Fire fighting design for large logistics warehouse [J]. Shanxi Architecture. 2009;35(29):191-2.
19. Dinaburg J, Gottuk DT. Fire detection in warehouse facilities. Fire Detection in Warehouse Facilities: Springer; 2012. p. 1-59.
20. Mulholland GW, Croarkin C. Specific extinction coefficient of flame generated smoke. Fire and Materials. 2000;24(5):227-30.
21. Tao S, Dong X, Tan Y, Wei Y, Wang B, Huang Y. Numerical simulation study on the smoke spread process under the influence of the hollow floorboard in the logistics warehouse. Case Studies in Thermal Engineering. 2019;15:100517.
22. Karlsson B, Quintiere J. Enclosure fire dynamics: CRC press; 1999.
23. Zhao J, Zhu H, Huang H, Zhong M, Yang R. Experimental study on the liquid layer spread and burning behaviors of continuous heptane spill fires. Process Safety and Environmental Protection. 2019;122:320-7.
24. Casal J. Evaluation of the effects and consequences of major accidents in industrial plants: Elsevier; 2017.
25. Kazemipour A, Afshin H, Farhanieh B. Numerical–analytical assessment of fire and ventilation interaction in longitudinally ventilated tunnels using jet fans. Heat Transfer Engineering. 2017;38(5):523-37.
26. Forney GP. Smokeview (Version 5)-A Tool for Visualizing Fire Dynamics Simulation Data, Volume I: User's Guide. 2017.
27. Hurley MJ, Gottuk DT, Hall Jr JR, Harada K, Kuligowski ED, Puchovsky M, et al. SFPE handbook of fire protection engineering: Springer; 2015.
28. McGrattan KB, Baum HR, Hamins AP. Thermal Radiation from Large Pool Fires (NISTIR 6546)
. 2000.
29. Rajendram A, Khan F, Garaniya V. Modelling of fire risks in an offshore facility. Fire Safety Journal. 2015;71:79-85.
30. Cozzani V, Salzano E. The quantitative assessment of domino effects caused by overpressure: Part I. Probit models. Journal of Hazardous Materials. 2004;107(3):67-80.
31. Book TG. Methods for the determination of possible damage to people and objects resulting from releases of hazardous materials. Report CPR E. 1992;16.
The results of their impacts can be better understood by the simulation of fire in chemical warehouses, the conclusions of which are as
follows:
- Numerical simulation of pool fire in the chemical warehouse, temperature distribution, and heat flux induced by pool fire at different intervals predicted that the effects of heat flux and temperature on humans and materials could be assessed.
- The numerical simulation results were compared with the results of the solid flame model. The maximum predicted error in the selected mesh size in the CFD model was 6.87%, compared to the solid flame model.
- In order to verify the results, laboratory methods were used. The estimated relative error values in predicting HRR and temperature were 26% and 4.6%, respectively.
Conflict interest
The authors have declared that there is no conflict of interest.
Authors Contribution
All authors contributed to the final version of the manuscript, equally.
Acknowledgment
This study is part of a Ph.D. dissertation which was funded by Shahid Beheshti University of Medical Sciences, Tehran. Iran. The authors wish to appreciate Shahid Beheshti University of Medical Sciences for their financial and technical support. The proposal was approved by the ethics committee prior to its execution (Project No:9497/20).
References
1. Assael MJ, Kakosimos KE. Fires, explosions, and toxic gas dispersions: effects calculation and risk analysis: CRC Press; 2010.
2. Muñoz M, Arnaldos J, Casal J, Planas E. Analysis of the geometric and radiative characteristics of hydrocarbon pool fires. Combustion and Flame. 2004;139(3):263-77.
3. Mishra KB, Wehrstedt K-D, Krebs H. Lessons learned from recent fuel storage fires. Fuel processing technology. 2013;107:166-72.
4. Directorate HI. Fire, Explosion and Risk Assessment Topic Guidance.
5. (2010).
6. Raj PK. LNG fires: A review of experimental results, models and hazard prediction challenges. Journal of hazardous materials. 2007;140(3):444-64.
7. Sun B, Guo K, Pareek VK. Computational fluid dynamics simulation of LNG pool fire radiation for hazard analysis. Journal of Loss Prevention in the Process Industries. 2014;29:92-102.
8. Hansen OR, Davis SG, Gavelli F, Richardson J, editors. Benefits of CFD for onshore facility explosion studies. 8th Global Congress on Process Safety; 2012.
9. Suardin JA, McPhate Jr AJ, Sipkema A, Childs M, Mannan MS. Fire and explosion assessment on oil and gas floating production storage offloading (FPSO): an effective screening and comparison tool. Process safety and environmental protection. 2009;87(3):147-60.
10. Sellami I, Manescau B, Chetehouna K, de Izarra C, Nait-Said R, Zidani F. BLEVE fireball modeling using Fire Dynamics Simulator (FDS) in an Algerian gas industry. Journal of Loss Prevention in the Process Industries. 2018;54:69-84.
11. Brohus H, Nielsen PV, Petersen AJ, Sommerlund-Larsen K, editors. Sensitivity analysis of fire dynamics simulation. Proceedings of Roomvent; 2007: Citeseer.
12. Weckman E, Sobiesiak A, editors. The oscillatory behaviour of medium-scale pool fires. Symposium (International) on Combustion; 1989: Elsevier.
13. Cetegen BM, Ahmed TA. Experiments on the periodic instability of buoyant plumes and pool fires. Combustion and flame. 1993;93(1-2):157-84.
14. Finney MA, Forthofer J, Grenfell IC, Adam BA, Akafuah NK, Saito K. Section B Fire and Explosion-A Study of Flame Spread in Engineered Cardboard Fuel Beds Part I: Correlations and Observations of Flame Spread. Progress in Scale Modeling, Volume II: Springer; 2015. p. 71-83.
15. Liu X, Li J, Li X. Study of dynamic risk management system for flammable and explosive dangerous chemicals storage area. Journal of Loss Prevention in the Process Industries. 2017;49:983-8.
16. Tan Y, Li J, Li Y, Huang Y. Study on the response of sprinkler system in logistics warehouse under the influence of the hollow floorboard. Case Studies in Thermal Engineering. 2019;14:100427.
17. Xiang-ning L, Detachment CF. Application of fire detection and alarm system in logistics distribution center. Fire Science and Technology. 2016(11):30.
18. Wei X. Fire fighting design for large logistics warehouse [J]. Shanxi Architecture. 2009;35(29):191-2.
19. Dinaburg J, Gottuk DT. Fire detection in warehouse facilities. Fire Detection in Warehouse Facilities: Springer; 2012. p. 1-59.
20. Mulholland GW, Croarkin C. Specific extinction coefficient of flame generated smoke. Fire and Materials. 2000;24(5):227-30.
21. Tao S, Dong X, Tan Y, Wei Y, Wang B, Huang Y. Numerical simulation study on the smoke spread process under the influence of the hollow floorboard in the logistics warehouse. Case Studies in Thermal Engineering. 2019;15:100517.
22. Karlsson B, Quintiere J. Enclosure fire dynamics: CRC press; 1999.
23. Zhao J, Zhu H, Huang H, Zhong M, Yang R. Experimental study on the liquid layer spread and burning behaviors of continuous heptane spill fires. Process Safety and Environmental Protection. 2019;122:320-7.
24. Casal J. Evaluation of the effects and consequences of major accidents in industrial plants: Elsevier; 2017.
25. Kazemipour A, Afshin H, Farhanieh B. Numerical–analytical assessment of fire and ventilation interaction in longitudinally ventilated tunnels using jet fans. Heat Transfer Engineering. 2017;38(5):523-37.
26. Forney GP. Smokeview (Version 5)-A Tool for Visualizing Fire Dynamics Simulation Data, Volume I: User's Guide. 2017.
27. Hurley MJ, Gottuk DT, Hall Jr JR, Harada K, Kuligowski ED, Puchovsky M, et al. SFPE handbook of fire protection engineering: Springer; 2015.
28. McGrattan KB, Baum HR, Hamins AP. Thermal Radiation from Large Pool Fires (NISTIR 6546)
. 2000.
29. Rajendram A, Khan F, Garaniya V. Modelling of fire risks in an offshore facility. Fire Safety Journal. 2015;71:79-85.
30. Cozzani V, Salzano E. The quantitative assessment of domino effects caused by overpressure: Part I. Probit models. Journal of Hazardous Materials. 2004;107(3):67-80.
31. Book TG. Methods for the determination of possible damage to people and objects resulting from releases of hazardous materials. Report CPR E. 1992;16.
Type of Study: Research |
Subject:
Special
Received: 2021/09/25 | Accepted: 2022/01/20 | Published: 2022/02/14
Received: 2021/09/25 | Accepted: 2022/01/20 | Published: 2022/02/14
| Rights and permissions | |
 |
This work is licensed under a Creative Commons Attribution-NonCommercial 4.0 International License. |